MARKET ANALYSIS FOR NOOBS!! PART #1

There are two popular methods to analyze a market price trend, first is fundamental analysis and the other is technical analysis. Fundamental analysis focuses much more on trying to determine the real value of the company, and it's characteristic. On the other hand, technical analysis only care about the price movement in market.
So today let's focus on technical analysis. Since fundamental analysis usually just involved lots of research on google, youtube review about particular company, twitter updates from company of interest, checking on companies' balance sheet. Technical analysis requires different set of skill, that is trying to recognize the repeating trends in market by looking at its historical prices. Thereby, predicting its future movement in price.
Technical analysis operates based on 3 assumptions :
1) Stocks price is direct reflection of everything that has or could affect the company
Technical analyst believe that company fundamentals or other economic factors are all priced into the stock. Which means technical analyst are just looking at the supply and demand of the market.
2) Price moves in Trends
After a trend is established before, it is believed that the market will LIKELY to move in such trends than to be against the trends. In other words, doesn't include other influential factor that might alter the course.
3) History Tends to repeat itself
As I said, technical analysis is mostly recognizing the repetitive textbook trend, thereby allowing us to predict the future market movement. Technical analyst believe that there will be consistent reaction to a market stimuli over time. So it's no wonder charts that has been used 100 years before still in use today, and it's proven to be successful in illustration of price movement.
Fundamental analysis vs Technical Analysis
This video intend to be word minimalistic and promoting simple to understand concept, check this out :
Sources : investopedia.com
Important concepts in Investment
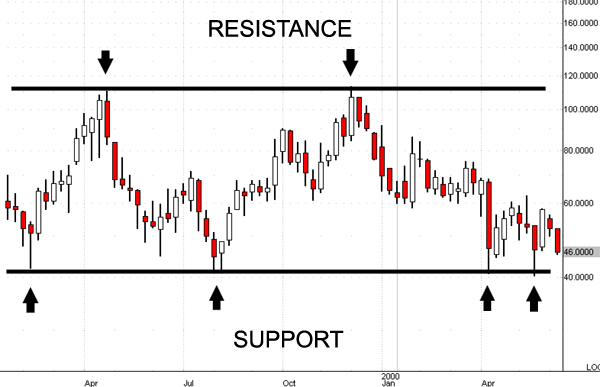
Support and resistance
Support means the price level that a stock or commodity seldom falls to. Resistance, on the other hand means that the price level the stock seldom surpases.

WHY IT HAPPENS?
Market psychology and supply and demand. Support is the price trader willing to buy, while resistance is the price trader willing to sell. Support exists because trader always buy in bulk when the price is getting too low, which makes it difficult to make the price falls below this level. Resistance level exists on round number peak, that the point where everyone will start selling off. It's market psychology.
IMPORTANCE OF ROUND NUMBER
Round number is a big factor in market. Because they represent the major psychology turning point which trader make buys or sell decision. Its way troublesome to set your selling or buying points down to decimals or cents. That's why round number is a point to keep your attention on.
HOW SUPPORT AND RESISTANCE CAN HELP US TRADE?
Case 1 : He/she found that the resistance was tested for a lot of times and never broken, he/she can use this knowledge to sell the stock before the resistance is reached. This is under the assumption that this is the maximum profit he/she can get before the market come to a selling trend again.
Case 2 : If a market trend constantly touches on support and resistance level, the trend is LIKELY to continue and said to be a strong trend. It is where it gives confidence to trader to invest more money and predicts when to sell.
Case 3 : Knowing the support or resistance level, will make you to avoid putting money directly on this level. This is because most of the cases, prices will never reach round number. If you're bullish in a paticular market trend approaching support level, you can put it higher than the support price but never directly on support level. If you're short selling, you can put in lower than support level.
That's it for today guys, I myself is still learning the concept of investment. I hope this publication helps all the newbies out there who wish to trade. Calculated risk can only achieved by knowledge. The more you understand, the better you trade! Stay tune for part 2! As I will try to look into the chart trend. If you like my writings please do the following :

Thanks for your article. I find it a bit hard to read charts and graphs.
Thanks for reading it, I will definitely make another post about charts on part 2! Stay tune too!
thanks for the help keep it up
Thanks!
Nice post.. good luck to your trading.
Thanks! Hope you can benefit from this tutorial!
@tngflx got you a $2.8 @minnowbooster upgoat, nice! (Image: pixabay.com)
Want a boost? Click here to read more!
Good.. step by step bro... coz the market is too volatile to follow.. write also bro about preparation before jump in the trader field... (MM : RM : EM)