Crypto Update: Amp Chart Analysis
"Buy when the fear is at the strongest. Sell when the excitement is so strong that you actually want to buy more."
Remember when I posted about Synereo trend yesterday?
Crypto Update: Bullish Trend Signal
Well, I almost doubted my interpretations as the price action tested support area twice that led me seek further technical advises from a professional traders.
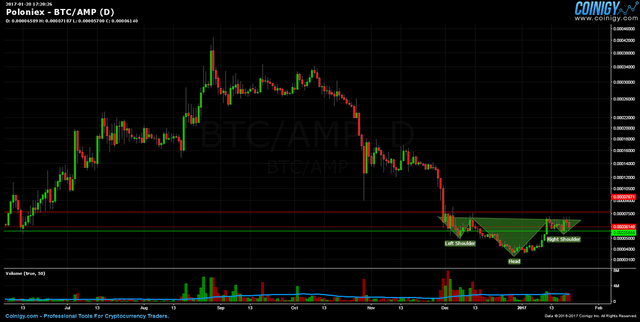
Apart from the coinigy chart analysis that claim Synereo is in a **bullish inverted head and shoulders pattern as shown below
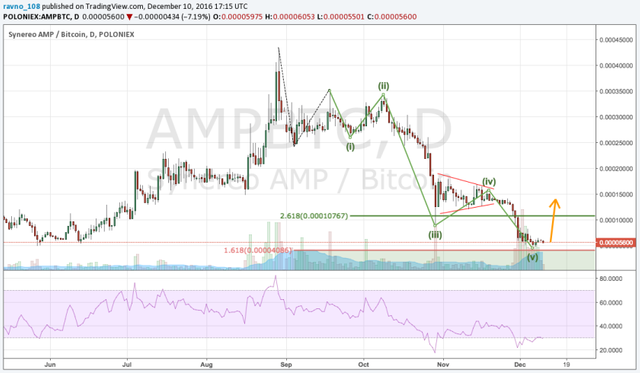
Here's an analysis of Amp Chart in December 2016 which definitely is unfolding as events moves to this direction.
Wave 3 is the perfect 2.618 of the wave 1. Wave 2 is clear zigzag, wave 4 is a triangle. To be honest it is one of the best 5 waves the author saw this year in crypto. And what we expect after the 5 waves down are completed, combined with such a negative sentiment we witness?
The rise.
Sounds strange and irrational when the project seem to be falling apart? But the trading/investing is pretty much exactly this – most of the time irrational and against ones deep emotion. Buy when the fear is at the strongest. Sell when the excitement is so strong that you actually want to buy more..
What is the target? Around 0.00014. Why? The wave 4 was a triangle, it is usual to have a pretty swift retrace to the origin of the thrust. In our case it was somewhere around 0.00014.
https://ethavest.com/2016/12/10/amp-synereo-is-a-very-interesting-case/
Hope this reinforces my chart analysis.
As of posting, $AMP seems to be breaking the silence as it gears to move upwards.
Happy trading everyone!


