Steel ETF (SLX) Price Analysis
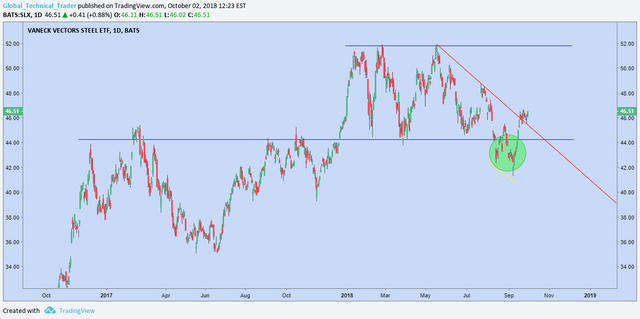
SLX is showing some encouraging signs at the moment. The daily chart shows price has completed a failed breakdown which occurred with bullish divergence present. It has also cleared the downtrend off the May high. Failed breakdowns often lead to aggressive moves in the opposite direction. Whilst it needs to clear the 52 level to be home free, the signs are positive.
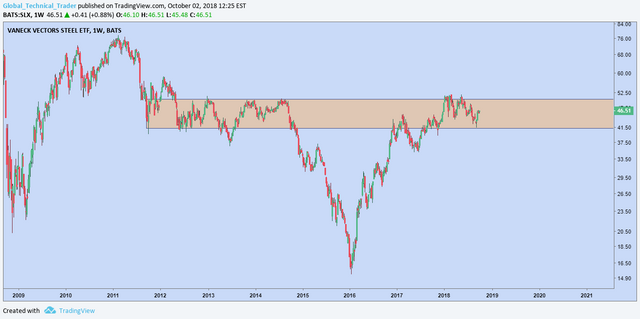
The weekly log chart shows that the recent rebound also coincided with major support and shows again the importance of that 52 level. IFFF that level clears, some significant bullish trading opportunities can be considered in the space. Worth noting that the rally in Vale looks to have legs. That can be taken as a positive lead on the sector.
Thanks for the analysis! Followed!
thanks!