Ebay (EBAY) Chart Just Gets Worse And Worse
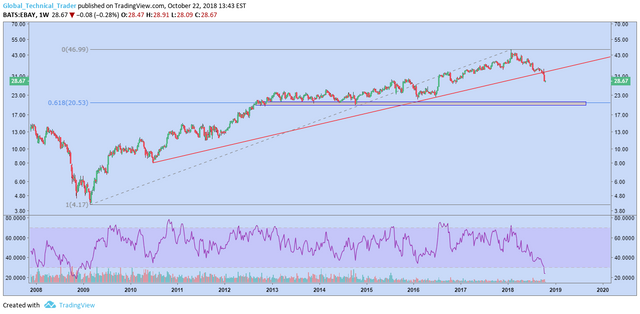
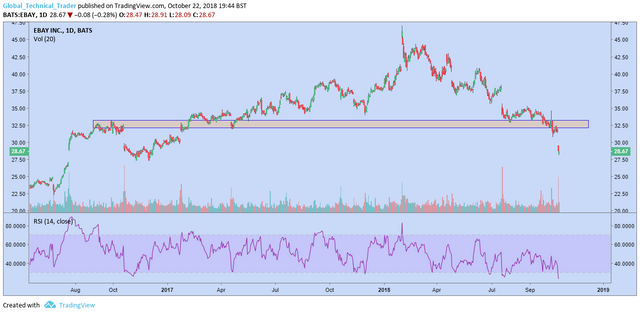
Major trend line support can clearly be seen to have broken on the Ebay chart and the daily chart below shows a big gap down on large volume which confirmed a failure of the support zone that has formed at various points since 2016. Also of note is the extreme low reading achieved in RSI, a feature that suggests not necessarily that the stock is oversold but instead, that momentum is confirming the weakness in price.
That leaves us searching for downside targets. The next major level of support to my mind is ~20.5 - 21.5, an area that price fluctuated around throughout 2012 - 2014 and also coincides with the 61.8% retrace of the 2009 low to the 2018 high.
It would take a move back above the resistance zone seen on the daily chart at ~33 before I would move to even a neutral stance on this one.
Thank you,
at this point I'am searching some American shares to trade in the evening here in Europe.
Still deciding if I'll do some day or swing trades with them.
Off course I'll make my own TA's before taking action, if I see something interesting I'll post it in your comments.
Please do. I don't day trade but always happy to see interesting ideas.