Bullish Breakout Beckons Bitcoin Cash
Bitcoin Cash Bearish Run Ending?
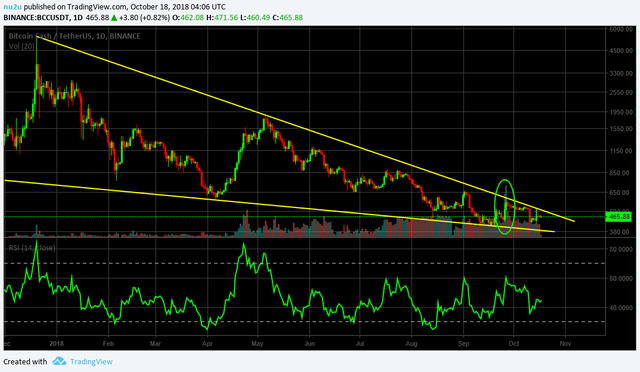
Since reaching its all time high of $5389.35 on Binance (the #1 cryptocurrency exchange by trade volume), Bitcoin Cash has been in and 11 month bearish down trend losing as much as 75% of its value. But that may be nearing it's end. Having reached a low of $408 on Sept 19th, BCH had its 2 largest volume trading days since it's been listed on Binance. As the daily chart below show, BCH lower highs have been greater than the lower lows resulting in a Falling Wedge which is a bullish pattern. A positive divergence is also present between the RSI and the price line. With Bitcoin futures expiring in 2 days we could still see a short squeeze which could propel BCH and other altcoins higher.
Charts by Trading View
Author holds Bitcoin Cash at time of writing
Smiling Duck
Congratulations @smilingduck! You have completed the following achievement on the Steem blockchain and have been rewarded with new badge(s) :
Click on the badge to view your Board of Honor.
If you no longer want to receive notifications, reply to this comment with the word
STOP