2018 Bitcoin summary. How beginner CFD traders could have made money?

While the leading currency lost over 80% of its value since the “peak Bitcoin” in December 2017, many day traders made fortune during the downtrend placing the right orders at the right time. Let’s go through some examples so you can decide whether it was within your reach.
2018 was a dramatic year for cryptocurrency HODLers. They spent most of 2017 with head in the clouds checking every morning how much the value of their crypto wallet has gained overnight, and probably buying more and more.
The bonanza was at its full speed in late November — early December and then… the crazy rollercoaster happened. Bitcoin nearly reached $20,000 on December 17. In the next 5 days, it dropped almost by half. Then in the first days of January, it climbed back to $17,000, only to plummet to $6,400 in the next month.
The bullish traders were fighting the downtrend throughout the first three quarters. Then in September, the volatility decreased. The BTCUSD entered a sideways drift that lasted until November 14. Bitcoin broke the $6,000 and then $5,500 support levels. In the time of writing this article, it’s testing the support levels from September 2017.
Cryptocurrency enthusiast wanted a trend reversal that never happened. The price of Bitcoin is going down, and 2018 was 100% of the time bear market.
Not a bad year for CFD Traders
While in the long run Bitcoin and cryptocurrencies have a bright future. The blockchain technology is developing and being adopted in new fields with success. Bitcoin as a long-term investment proved to be a horrible choice for the people who hunted for buy low occasions in 2018. On the other hand — who knows maybe we have reached the bottom already. We’ll learn in the next days, weeks or months.
While the cryptocurrency market capitalization fell from almost $831bn in January 2018 to $104bn in mid-December, crypto CFD traders have nothing to complain as a well-trained eye can see strong technical analysis patterns that navigated the traders through the uncharted waters.
For skilled traders, the first half of 2018 was a great period as Bitcoin Volatility Index stayed above 7% in January and February, then fell to average levels. The third quarter was a lazy time for Bitcoin day traders as the volatility fell below 2%. Things came back to life in November and by December it was way above 5% again.
Some profitable CFD trades were made across the world. Let’s take a look if the 2018 trading opportunities were within a reach an intermediate individual trader and check if a beginner trader could have made some money.
We’ll retrospectively use just the basic indicators: Japanese Candlestick Reversal Patterns and Fibonacci Retracement Tool, and see if it was doable. We’ll take a look at the BTCUSD chart — the most important cryptocurrency — in a different scale — from macro 1-week view to the most detailed 1-minute. Let’s go!
Perfect bearish engulfment
We’ll take a look at a broad picture with weekly candles and see if the big trend reversal was preceded by any sign. It turns out it all started with a strong bearish engulfment pattern.
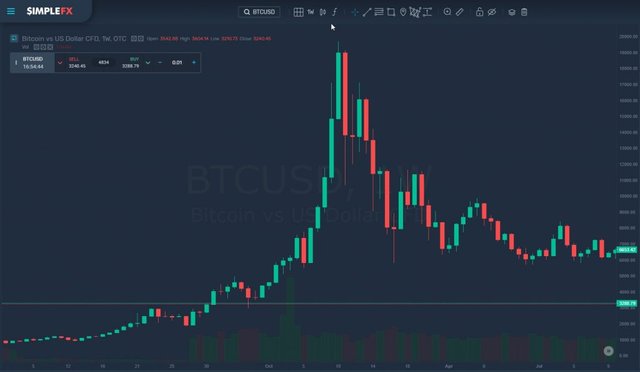
The green candle representing 12/10/2017 week is fully engulfed by a huge red candle in the next period. Furthermore, the pattern is confirmed by a red candle. You usually start your technical analysis course with learning how to read Japanese candlesticks. This means novice traders actually had an advantage including this sign into their strategy, as they had no other indicators that would disturb them.
Where there any extraordinary skills necessary to choose the right strategy at this point? You needed to use a multiweek view, a long-term attitude that requires a lot of self-control and discipline, but this shows that in the case of market turmoil it pays to stay calm.
Capitalizing on opportunities with Fibonacci Retracement Tool
Technical analysis tools are very useful when trading cryptocurrency since there are little intrinsic value indicators that would be useful in determining the price.
Let’s see if Fibonacci Retracement was useful during the early 2018 crash.
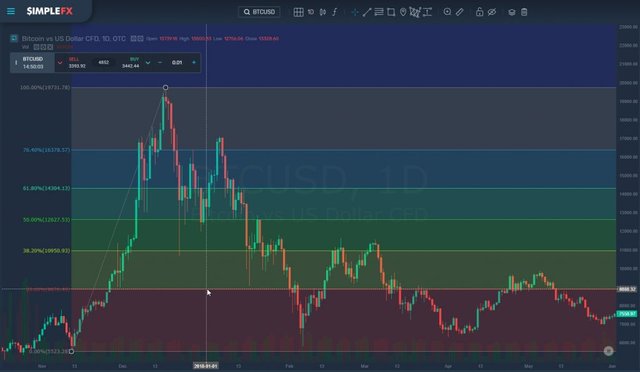
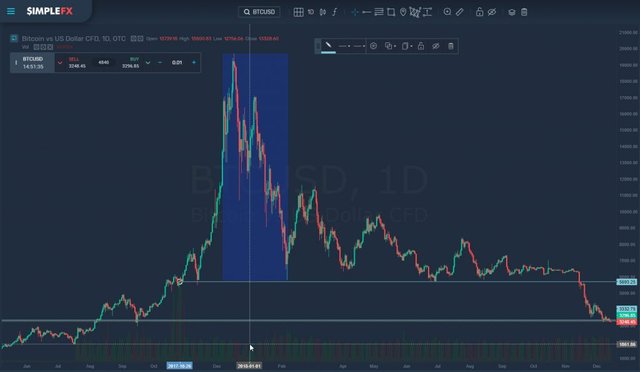
As you can see on the BTCUSD 1-day chart, Fibonacci levels often were the sign for a retracement or reversal. Trying to get into the minds of 2018 Bitcoin traders I connect the swing low from November 12 with swing high on December 17.
Let’s imagine I’m doing it planning my trading strategy after the New Year’s Eve party on January 1, 2018. Here are the Fibonacci levels projected on a one day chart for the first half of 2018. At the beginning of the year when the local bottom was reached on February 6, both the first and the second resistance levels proved to be useful when taking short positions for traders that included year-long downtrend in their trading strategies
.Now let’s take a look at BTCUSD retracements at a 1H chart in mid-December.

You can see that what seemed to be just a rally in a continuing downtrend proved to be a trend reversal. It was difficult to predict at first, but proved to be quite obvious once the huge green candle breaking through three resistance levels occurred.
At this point, even a beginner trader could readjust the Fibonacci Tool, and start placing buying orders making profit with each retracement. With each confirmation of an uptrend, you could add to the long long position using local pullbacks to get the best price.
What’s next?
If you are a beginner trader, you should go on practicing the basic trading strategies and excel in opening and closing positions at the right time. Nobody knows what will happen with Bitcoin and other cryptos in the next months, and that’s your strength, too. Unlike with stock or forex markets, you have the same knowledge as the biggest players. That’s the beauty of cryptocurrencies.
Here’s an interesting opinion that’s not just an empty talk. Mark Dow is a former IMF economist, who became a worldwide famous trader as he hit the jackpot opening a big short position on Bitcoin a year ago, exactly at the point of historic “peak crypto”. Since then BTCUSD declined by over 80 percent, and Mark Dow decided to close the trade.
Just as the euphoria surrounding Bitcoin was peaking in December 2017, Mark Dow decided to short the leading digital currency. Almost a year to the day, and after a more than 80 percent decline from its record high price, Dow has closed out the trade.
“I’m done. I don’t want to try to ride this thing to zero, I don’t want to try to squeeze more out of the lemon. I don’t want to think about it. It seemed like the right time. People buy into these assets because they believe the narrative, and you look at the asset prices to see if the narrative is weakening or changing. It’s not easy — you could be wrong, but that’s the sign you look for. But it doesn’t mean you’ll get it right” — Dow said in a phone interview with Bloomberg.
As you can see, it’s much easier to master the basic technical analysis tools than to read the macro trends. While there are many useful tutorials concerning the first, there is as much false advice about the latter.
Pick up a handy CFD trading tool and learn step by step how to recognize trends and execute effective trading strategies. SimpleFX WebTrader is a great app for a start since it offers you a fully functional demo account for practice, and live accounts in any currency with no minimum deposits, so you can gradually increase your investments as your skills develop.
Good luck trading in 2019! Hopefully, it will bring as many trading opportunities as 2018.2018 beginners bitcoin Bitcoin 2018 featured technical analysis
Originally published at blog.simplefx.com on December 20, 2018.