The analysis of the price of Litecoin

The Litecoin/USD pair (LTC/USD) launched its bullish run on December 8, 2017, when It went beyond the resistance of 110. The breakthrough was seen by players who pushed the price to $ 375 on December 19. At this level, the market appeared very overbought indicators. In addition, in 11 days it grew by more than 240%, which caused lively sales.
As the market provided profits, on December 22 it fell to 173.68, but closed at 264.98. The price movement created a long wick under the body of the daily candle, indicating the presence of bulls at this level. As a result, the market jumped and reached 306.80 on January 6, 2018. Since then, the pair has steadily declined, while the daily trading range has been gradually narrowing. On 14 February, there were signs of movement.
Technical analysis shows that yesterday the LTC/USD pair withdrew from the pattern of bullish trend continuation when it reached 217.72. The rise in prices was accompanied by an extremely large volume, confirming the breakthrough. Usually, after a breakthrough, there is a short period of consolidation. Let's be patient and start buying on the bottom.
The strategy is to buy as close to 200 as possible. After consolidation for some time, the market is likely to reach the goal of 360. This process can take about a month.
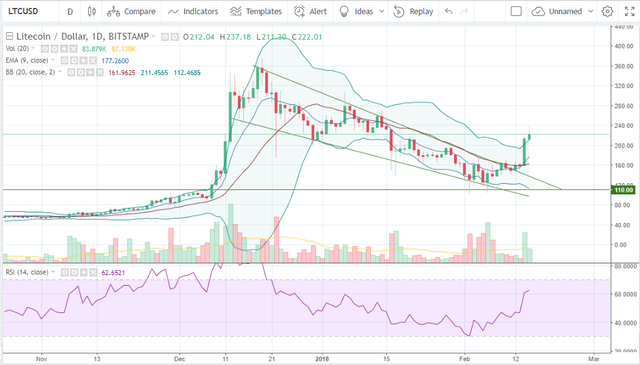
Litecoin/Dollar daily chart by Bitstamp
Your publication has been successfully shared, with more than 2651 Steemit users thank you for participating in the last edition of free reestem.
If you find my project useful, donate a vote to my comment