Bitcoin price analysis - USDT/BTC on Poloniex
Brief overview on the price of Bitcoin via a daily chart - congestion for now but are we approaching a directional move?
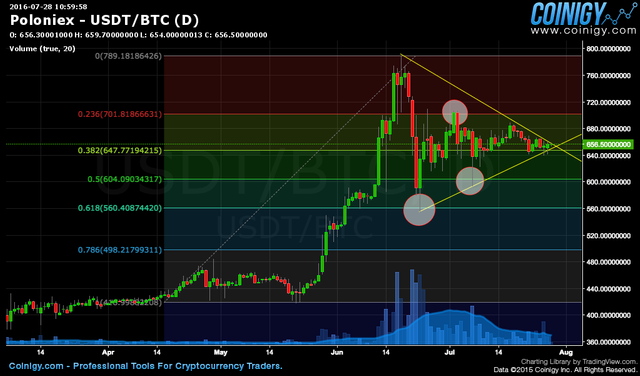
After a decent bounce at 560 and 600 (which are respectively 62% and 50% of fibonacci's levels) price seems to have entered a period of low volatility which has lasted for almost a month now and started on a trading range between 700/600 which during the second part of July got tighter to 680/640.
Summer months are usually quiet and possibly the same logic can be applied to cryptos, said so periods of low volatility and range are often followed by directional moves; as volume starts creeping in monitoring breakouts to the upside of 700 or the downside of 600 would give good hints to where its heading next.
Disclaimer: The information contained herein is not guaranteed, does not purport to be comprehensive and is strictly for information purposes only. It should not be regarded as investment/trading advice. All the information is believed to come from reliable sources and the author does not warrant the accuracy, correctness, or completeness of information in its analysis and therefore will not be liable for any loss incurred.