Moving Average Exponential(EMA):How to analyze the direction of financial market using EMA
Moving Average exponential is a type of moving average.
Moving Average exponential is a trend following indicator.
Since Moving Average exponential is a trend following indicator, it is therefore used to indicate the direction of the market, that is whether the market is moving upwards or downwards.
Moving Average Exponential is based on bullish and bearish as well as support and resistance.
Just like in weight moving average,moving average exponential also places more weight on recent price than on previous price.
Therefore,Moving average exponential is calculated using the following formula;
EMA= (Current priceZ)+(previous EMA(1-Z)
Where Z is the smoothing constant % for price value calculated as 2/(n+1)
where n is the number of periods.
Therefore, since moving average exponential is a trend following indicator and is based on bullish and bearish ,it therefore follows that when the market is in an upward trend,the moving average exponential will also be moving upwards.On the other hand, when the market is in a downward trend, the moving average exponential will also be moving downwards.
Based on support and resistance, when the price rises above the moving average exponential when both are in an upward direction, the market and the moving average exponential will experience a downward reversal thus signaling the trader to close any buy position and open a sell position.
On the other hand, when the price falls below the moving average exponential when both are in a downward direction, the market and the moving average exponential will experience an upward reversal thus signaling the trader to close any sell position and open a buy position.This is indicated as from the candle sticks chart below;
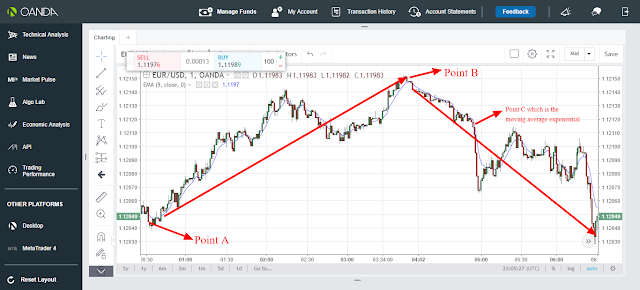
From the candle sticks chart above, there are 3 points, point A, B and C. Point A and B represent the support and resistance points while point C which is blue curve represents the moving average exponential.
At point A, the market and the moving average exponential were initially moving downwards.The price then falls below the moving average exponential thus resulting to an upward reversal direction for both the market and the moving average exponential thus signaling the trader to close any sell position and open a buy position.
On the other hand, at point B the market and moving average exponential were initially moving upwards.The price then rises above the moving average exponential thus resulting to a downward reversal direction for both the market and the moving average exponential thus signaling the trader to close any buy position and open a sell position
Recommendation:If you are a day trader just use 1 min, 5 min, 15 min and 30 min timeframe while if you are a swing trader just use 1 hour and above timeframe if you want moving average exponential indicator to work well for you
You are always free to support our work from below;
skrill donation:[email protected]
Neteller donation:[email protected]
Bitcoin:1Fp5aLgRB6WJnC7nxGw57M3JbbexaAWHG2
Ethereum; 0x346570c491b76c7cd51699bdd272762111b743a9
Litecoin: LeEH7B82ccXJ6QoibCryGJNpDGNx2x77fL
Dogecoin: DLShs2vqhMc1ggqo8MPPMBTcPAZdqCZoWd
lightning network:tipping.me:https://tippin.me/@quintomudigo
Warning! This user is on our black list, likely as a known plagiarist, spammer or ID thief. Please be cautious with this post!
If you believe this is an error, please chat with us in the #appeals channel in our discord.