Awesome PAY trade yesterday, and how to use Volume on a chart
Good afternoon friends,
I had a few minute free to make a video and answer some of the questions I have been getting. Yesterday I had a power failure, and was stuck trading from a mini laptop 11.5 inch screen and the internet from my phone. Gah.. I was trying to keep up with all the positions I was in, and then there was a crazy trade opportunity I want to tell you about. PAY/ETH dropped huge after the ICO...
As always, thanks for watching. I hope you found some helpful content in my video. I try to tell it like it is, so that new traders can avoid the pitfalls of using indicators and buying unsafe areas and so forth. There is so much bad information out there, I really want to be a positive influence and point traders in the right direction.
Luc
Hey Luc and everybody joining in this nice community,
Its nice to see people helping each other like this so everybody can profit. I experienced that navigating through the charts on Coinigy is sometimes clumsy. I figured out some quick tips that makes life easier. Maybe it helps some of you:
Thats it for now. I hope it helps somebody.
Julian
By the way, i'm was fully invested before the whole altcoin market seems to drop and don't know how to get out of this misery, but that's another thing...
oh nevermind, i just found out that function has been mover to right click options on the chart
Haha, had the very same problem yesterday =)
That was a great comment, thanks for the tips on Coinigy.. This morning I lost the orange button that gets rid of history and trades on the charts, do you know of another way to get rid of history so I can view a clean chart, without all my past trades pinned all over the place? Im submitting a ticket with coinigy, cuz i use that button alot
Awesome tips! :) Thank you! - And I'm also stuck, haha. But that's because I transferred ETH to the exchange. Should have transferred into USDT. But hey, maybe that's not even possible. :) Maybe I'll take a partial loss on ETH just to get going with all my new knowledge. :) Cheers!
thanks so much! especially for the estimating percentage tool. Was doing this manually, which i didn't mind but this makes it so much easier!
Thanks. Very Useful tricks
I'd been hoping Luc would maybe do a quick guide to Coinigy at some point, but this is really handy to start with. Thanks for taking the time!
Thanks for the tips! Quick question: do you happen to know if there are any other shortcuts, for instance to switch on the "price range" option, or to switch off "auto"?
Alt + R resets to "auto" (At least for Mac, should be anything with R for Win)
Scroll the Chart with Arrow keys (press alt to scroll fast, No action for up/down)
Alt + H for horizontal line (guess what the vertical line is)
Thats it. In my opinion they could discard the option to type in the symbol and set millions of nice shortcuts instead. They kept it as they adopted the chart engine from tradingview.com i think. There it's pretty useful.
Wow, even those can save a lot of time! I used to work with the Price Range tool, but all those mouse clicks... Now, I can do it as follows:
Alt-H for a horizontal line
Shift-Drag to define a percentage
Alt-H again
Thanks much for your reply!
where you said "hope you didnt get in over here or ouch"... yeah.. lost $5g lol
Thanks again, epic content Luc. I've created a Telegroup so we can improve together guys https://t.me/joinchat/FrprT0RIehp_lKDFtTJRyw
The link isn't working...
I had the same problem, then I figured out that you need to get the 'Telegram' app either on your desk top or your phone. Then click on the link, and you will be added to the chat group. This applies to the market scanner released after is video too.
Works like a charm.
Hi, love your videos! Absolute pure gold! Sorry for several questions. I hope you have time to answer them someday.
Is there a minimum % you usually always take the first trade lets say eth usd is at 200 now and the base get cracked. Would you put your first bet to 180usd and next to 160usd (20%) next to 140usd (30%). Do you always use the same percentages, what would be good quideline to set orders.
You mentioned you use more money the lower it goes because its safer. Lets use previous example and lets say you have 1000 usd to trade. How large order you use in 10% drop and the next and the next. Would it be something like 100usd to 10%, 200usd to 20% drop, 300usd to 30% drop and rest if it gets any lower and sell somewhere like 195 all. How would you diversify that order. What % drop is considered huge opportunity?
Do you sell most of your holdings at base and when do you decide to let it ride and not selling that in base like in eos trade? You often mention like there is huge 40% move up from bottom to top and base you started is in halfway of that. So in order you to get that 40% you should enter and exit perfectly while the safe way to play is 20% profit. I think that is a bit misleading.
About bankroll. Lets say you can afford to lose your bankroll, 1000 usd in this case. I quess in ethereum you can trade it all when base cracks. What about other coins. What % of your bankroll you usually trade.
You said you have 30 coins in your watchlist. Can you mention your top 5-10 you like to trade with great consistency like in ethereum and where new traders could start their journey.
Is there an easy way to figure out how large amounts of money you can trade by looking volume or something else. How could you easily determine how much money you can trade with without getting risk of not getting your orders filled at top for example.
Where do you find the news most fastest like in pay trade case. Do you just keep googling pay every 5 minutes or do you use forums, newspages or what.
I think these all questions we all would like to know.
Thank you for any help!
no, i dont use the same percentages.. and I have never ever seen a base crack on ETH that didnt pay, so im not worried about any trade that I take on that coin.... There really isnt an exact science to the percentages, you are dealing with a ton of human traders, so every dip goes down a different amount, there is no way to predict the size of the panic drop you will get..
you have to guage the drop by the length of other drops in the past.. so if you are aproaching one of the deepest drops compared to all the others in the past 2 months or so, i would jump in heavy
EOS i want to hold longterm, but i dont have any right now, because of the situation (1year of dilution) but yes i keep a little of every trade as coins in profit and store them away.. i keep different amounts based on how much profit i made on the trade... if i made 20% on the trade, then i might keep 20% of the coins for the future..
Risk verses reward.. so if its very safe like ETH then my buys might be as big as 50% of my account.. if its less safe like AMP, then i might risk 2% of my account
Steem for sure LBC, UBQ, SNGLS, BLITZ.. those are a few of the ones ive taken alot of trades on lately
Time and Sales.. you just want to watch the tape and look at level two to see what is normal for the stock, you want to blend in with normal orderflow
I watch troll boxes if I am in a trade that dived for what traders might be saying..
These very important questions you have asked.I'm looking forward to answers from luc
Really helpful video!
I just wanted confirmation that I'm doing this right
!( )
)
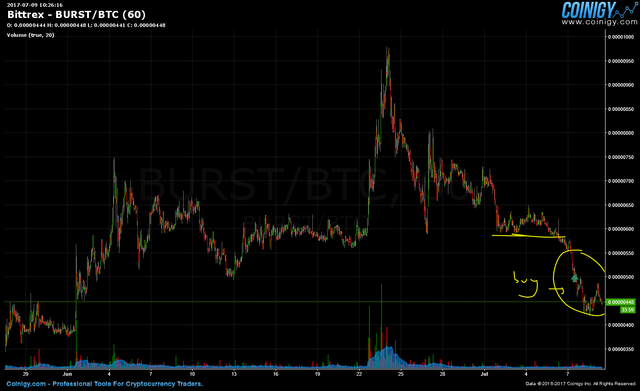
have I identified the base correctly here? BURST/BTC on BTRX
Yup your right on with your buy, heres my chart .. and you can see where I took the trade and where im set up to get in again.. this is a beautiful chart, but yeah, really thought it was about to return to that base, but it still seems to want to dive, however everything is falling right now.. im loving this action
I'm eager to know what you did with this trade because it didn't return to that base level (yet) did you accept the loss or are you still holding?
my PAY trade was a very quick trade if I remember correctly.. id have to rewatch the video, but I think it was a quick drop and pop.. anyway, i dont hold it, because the IOU that i traded was way way over valued..
I'm still wrapping my head around all of this (so take it with a grain of salt until Luc jumps in here) but it seems to me that that isn't a base because there's no big bounce back. Just a lot of sideways trades that get smaller and smaller.
yeah I suppose that makes sense. I guess the large base before it doesn't count because its not the most recent?
Thats a base also,it depends on the chart you are using. if you are using a 1hr chart or 15mins or 5 min chart. On a 15 and 5 min chart that will look like a deeper crack.
Hey Luc another great video. Good job with making gains off that scary drop. I have two questions.
Another great video. Thanks again!
Bases are starting to make a bit more sense. But mostly seem easy as your drawing/explaining them.
When I start to look myself I get a bit more confused on the timeframe and the scale.
Too many questions I know. Thanks again for your time and knowledge.
Hey Luc, it's great to see you uploading again. Do you have any suggestions for low market cap coins that have decent volatility? Trying to build my portfolio up.
Thanks
Another chart for you, this time KMD/BTC 4 hour chart on BTRX. Would you consider my yellow lines bases and would you initiate a trade where I drew yellow circles? I'm just getting a feel for what kind of profit percentages you are usually looking for when it comes to these trades, and how much of a bounce you usually look for before you draw a base. Thanks!
Hopefully you can see the chart, looks small in my preview and I don't know how to make it look bigger in steemit..
When you post a chart and tell me the exchange, as you have done, i also look it up on my Coinigy,, so the quality/size of the chart is not a problem.. Yes! for sure.. I would and will be buying KDM/BTC if it cracks and panics into the low .0004s for an easy 15-20% .. or if it really panics and goes even lower, that would be awesome.. its a perfect chart, i just looked back at all the beautiful panics on it.. awesome possum
Great, I appreciate the quick feedback! I think I'm getting the hang of your strategy. I'm looking forward to your future video content, been studying the ones you've posted thus far and learning lots from your reply to comments. Thanks a bunch, from a fellow Canadian trader =)
Great video. Since I only got a couple hundred dollars I'm trying to play around with low volume coins. It's hard to find low volume, high volatility coins that aren't pump and dumps. Maybe you could touch upon trading these in your videos? It seems that these coins like to move in channels, should we simply buy in the low range and sell near the top? Or is there another strategy?
If your working with low volume coins, then yes, I buy in a range, and it workd just fine... but i cannot stress enough, that you have to take into consideration a month of chart data.. you need to trade in the context of what happened all month.. otherwise you cannot know your odds.. so if its been ranging really nice for a month, and you can get good percentages within the current range, then I would use that ti build your small account to a few thousand bucks.,. then you can join me and catch those panic drops and really build a small fortune.
Hi. I have a question. What is the priority, the trick or what should I look for to choose this kind of low volume coins? Thanks.
You need to look at one month of chart data to see how it reacts to cracks of support, or is it ranging with good percentages
Luc. When you enter your positions, do you have a systematic way of layering in?
Do you use a set number of tics to enter each time for each price level? Do you just eyeball it? Do you wait for price to seem to slow down?
As price is falling, do you add MORE size up to your desired risk? I.e., would you first entry be $1, then your second entry $2, and third $4, or some scheme like that that allows for a lower average entry price the further price drops?
Is this a systematic process for you, or is it something you've just developed a 'feel' for over time?
Yeah, im set up a bunch of buys like you said 1 then 2 then 4 and what not.. but If im there and whatching as its falling then, i will quickly adjust those prices if it seems like is slowing down or there are buyers coming in or there is some news I didnt factor in.. SO i have often been buying like 1 and then 2 and then 4 and then i see huge buys come in and i get like 50, which makes the 1 and 2 and 4 meaningless... Basically im saying that if im not there, its all small tiny buys, but if im there to work the position, im ready with my guns to go for the kill
Sweet video luc, and so many questions but one that sticks out to me from the reply on this comment is how to know exactly when that big buyer is not stepping in and thus giving you the green light to buy heavy? Theres no alert that can be set for when a certain size trade goes through right? Because to my understanding wouldn't by the time you see the green bar on the chart that there was some decent volume be to late to then take advantage?
The big guys have the same chart info as you to.. they dont know any more than you,, so if you look at previous panic drops, you can pretty easily guesstimate where the drop is getting overextented.. when you start to get a longer drop then you have ever seen on the history of the chart and there seems to be good volume, i would jump in with both feet.
So... is there any rule of thumb on WHERE to enter? Or are you doing as you mention, where you just kinda base it on the prior panic drops(approximate distance) for entry?
It just seems like you 'could' buy anywhere?
Am I overthinking it?