Technical Analysis - Convergence Chart Pattern in STEEM/BTC 4H
Convergence pattern happen. Is this a bullish signal / uptrend ? Lets see !
Hallo, on this occasion I will share my technical analysis of market STEEM/BTC. I made this analysis in Tradingview. I use the 4H timeframe and with the help of the MACD indicator.
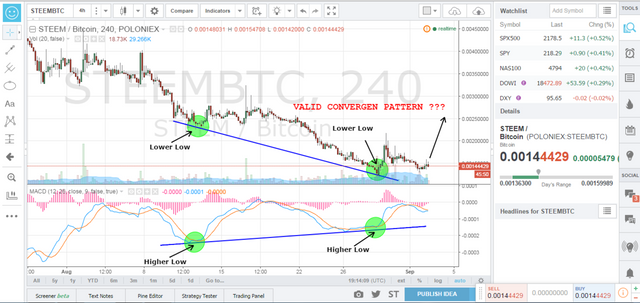
please see the picture below ...
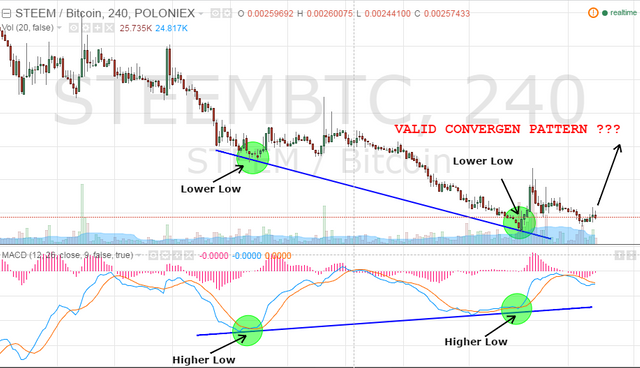
On August 12, 2016 chart makes a lower low in the price of 0.0022, then on August 29, 2016 back to make a lower low that is lower than the previous low, ie at the price of 0.0012. I marked with a green circle. But we can look at the MACD indicator that the low market sentiment in both tend to be higher, this indicates a converging pattern. This means that the down trend is over and it is time to change into the trend is up. I mark a low in MACD uses green circles as well. You can see in the picture.
Buyer sentiment has begun to diminish that seller are already preparing to raise prices. This will indirectly impact on the formation uptrend in the future.
Is convergent pattern that I made it valid? I can not guarantee 100% of my analysis is valid. I made this conclusion based on the events that have occurred in the market. But to know the confirmation of the reversal of the trend we will see tomorrow. Tomorrow I'll post about this continuation of my analysis.
This is my chart link on Tradingview https://www.tradingview.com/chart/WLEXo9bP/
Please give feedback if there is something wrong about my analysis of it.
Thanks
by @moch-yusuf

I think the pattern you identified, in Technical Analysis is usually called Positive divergence :)
anyway, it was already played out as a correction move in 2016-08-29 and no new divergence occurred after that. So we are still in the downtrend.
right, thanks for correction :)