Trading ideas on Tuesday! BTC, ZEC, XRP and LTC
Good afternoon my dear steemians and traders!
💰 Capitalization of crypto-economics: $424.853В
💵General trading volume: $ 17.845B
💥The share of bitcoin: 34.9%

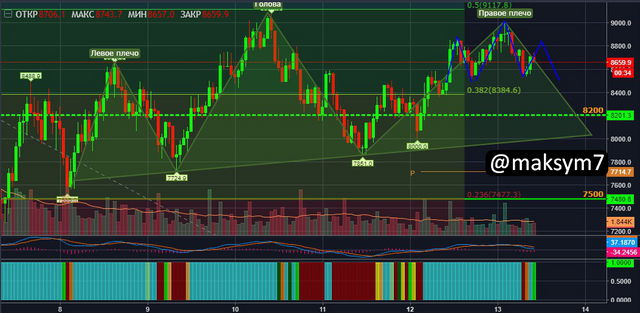
BTCUSD: not so obvious as it seems
A lot of patterns are formed on Bitcoin, the first one is Head and shoulders for completing the local uptrend, but here it is worth mentioning, firstly the price painted at least 3 left shoulders, which already damages the figure and even cancels it, secondly, the right shoulder is smeared and too high, in the third The head and shoulders in such areas are less significant than when the major trend is over. In the right shoulder one can observe the formation of one more Head and shoulders, which most likely will not be formed and the price will drop to $8200. In my opinion, it is appropriate to draw not the Head and shoulders, but the double top with the high $9074 and $9000. Nevertheless, all these patterns, no matter how diluted they were, will most likely drop the price until the end of the day. Option with a jerk to $9074 and 50% Fibo is possible, but the rollback from there forms an even sharper double top. P.S. A prolonged flat, above 38.2% Fibo, can break all these patterns.
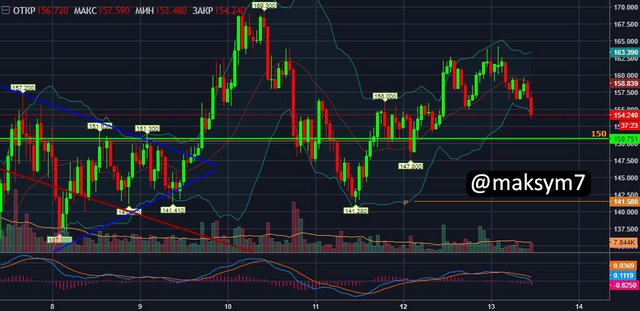
LTCUSD: will test level $150
The "Head and Shoulders" pattern was not fortunately formed. However, the breakdown of the lower Bollinger Band serves as a signal to the short-term short to support level $150. Given that overbought on MACD survived after the fall, this scenario seems very likely. The fall below the level $150 to the reference Pivot, I do not yet consider, because for this at the moment there are no grounds.
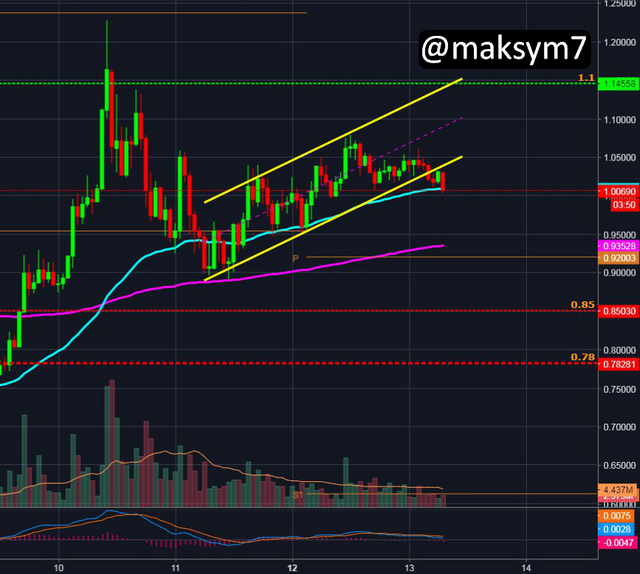
XRPUSD tests EMA50
Not reaching the resistance of $1.1, Ripple came out of the local uplink channel down. There is a chance that the EMA50 will keep the coin from further decline and return to the channel of the uptrend. Otherwise, XRPUSD will drop to the weekly Pivot reference at $0.92. There the quotes will receive support from a two-hundred-day moving average hourly chart and EMA50 4-hour, then, most likely, bounce up.
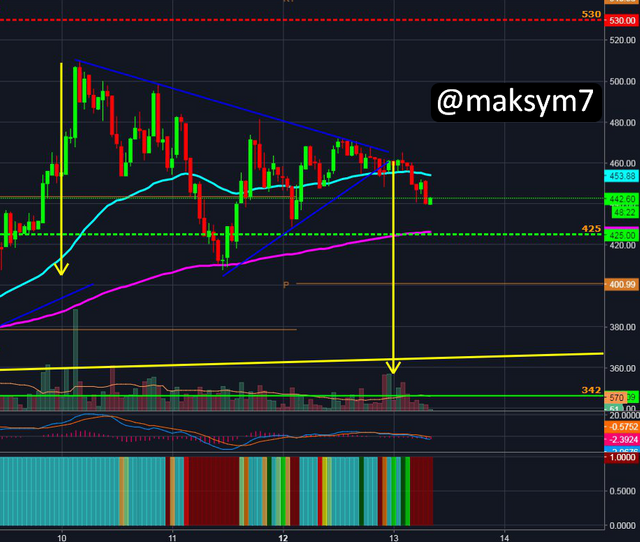
ZECUSD punched the triangle down
Zcash punched the pennant down. The target for working out the figure points to the long-term uptrend line (marked in yellow). With her plan to take longs.
Chop Zone confirms the presence of a bearish movement, but on the other hand, after the punching of the pennant, the volumes quickly fell much below the average - sellers can exhaust themselves before ZECUSD reaches the target. Possible stops on the way down:
- support $425, reinforced by EMA200,
- a weekly Pivot reference for $400.
If there are here those people who share my opinion with me, then please follow me! If there are critics, then please leave them in the comments. I'll be very happy!!!
I wish you profits!!!

Information presented in this material is the opinion of the author (@maksym7) and is not an offer to a specific action.
This post has received a 1.55 % upvote from @boomerang thanks to: @maksym7
Very good analysis of BTC, LTC,XPR, and ZEC. How about ETH?
According to the ETH there is nothing special, the last days are flat. There are no bullish or bearish signals from the indicators. Level $840 has lost its value and was removed, as the price often ignored it. In the event that Bitcoin falls to $8200, the ETH drops to support levels of $725.
This post has received a 0.70 % upvote from @booster thanks to: @maksym7.
Ripple is amazing. Got my first lambo after buying at all time high and selling bellow 1 USD. DIdn't even had to hodl! Read my story – you will find a nice surprise inside!