Bitcoin: BULLISH PENNANT [Continuation pattern spotted]
Even thought I was expecting a triple low, you can't get trapped in desires. So let's stick to what price is showing and the patterns that is projected rather than what I can expect. There is a strong bullish sentiment and this can't be ignored.
Bitcoin/USD is in the middle of a bullish price structure
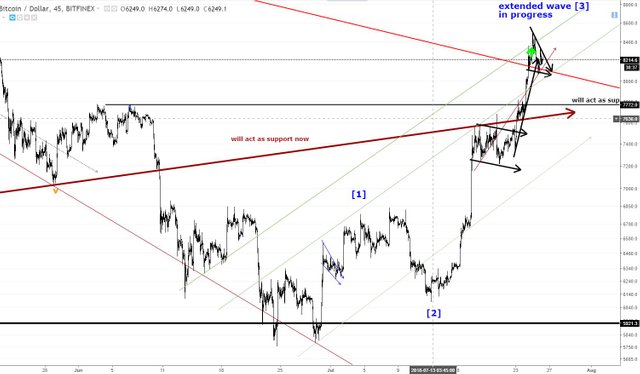
We're clearly in an extended wave [3]. Wave 3 is likely to be an extended wave.
Loads of FOMO lately in Bitcoin. Good increase in price, several key bear trends broken.
Check out the channeling in the green lines.
Let's zoom in to see the bullish pennant currently forming
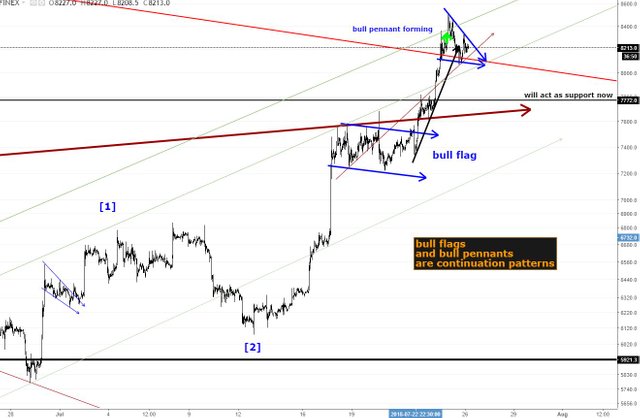
After breakout this bullish pennant will be confirmed. Most likely a continuation pattern.
Certainly triangles can be ending patterns, specially in wave 5.
However I think we're still in an extended wave 3 and this pennant will break upwards.
There is a major fundamental factor going on which is the potential ETF which will drag loads of new money and attention from the media.
Let's point out some conservative targets for this bullish pennant in the short term
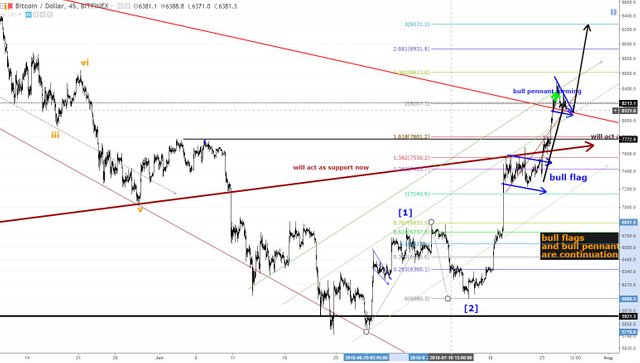
This would be a conservative scenario applying fibonacci projections and technical symmetry of the pennant's move
This would be a conservative target if the pennant breaks upwards.
However I think if we get around 10k is very likely to be a retest level.
Technical analysis gives tools to asses risk/reward strategies but logic is also important.
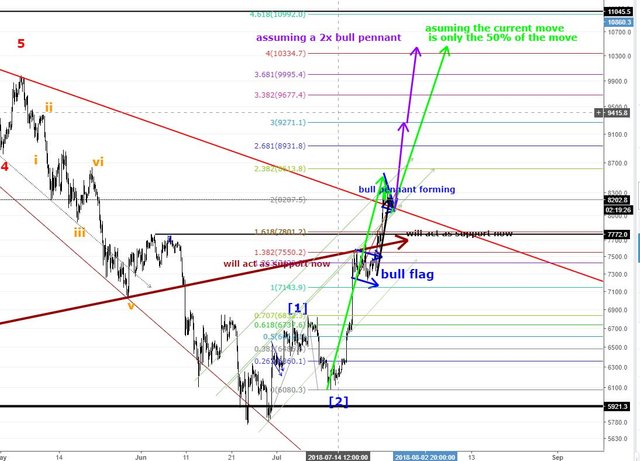
More detail on potential targets using symmetry and fibonacci projections
Molt Bon TA, com sempre...
Gràcies pel support!
After price was rejected at $8,500 two days ago, it has since struggled to determine which direction it will head next. There has been lots of speculation for downside and upside potential but neither have yet been confirmed. With the amount of speculation of the bull run activated, a large amount of money has been since invested into Bitcoin, being the most likely reason price has been able to hold fairly steady and reject a sell off or a major push higher.
On the 4hr chart it is obvious of a base that formed at $8,100 where price has previously found support/resistance which allowed price to bounce steadily back to $8,270. This small base and steady bullish movement away from this area could be enough to result in a retest of $8,500.
Nice one. I think we're in the middle-ending of the wave (4)of a (5) wave move. Waves 1-3-5 are impulsive waves meaning next wave is about to go up.
THanks for your comment steve!
This post has received a 3.53 % upvote from @booster thanks to: @luiggih.