Technical analysis Bitcoin BTC/USD - 27.08.2017
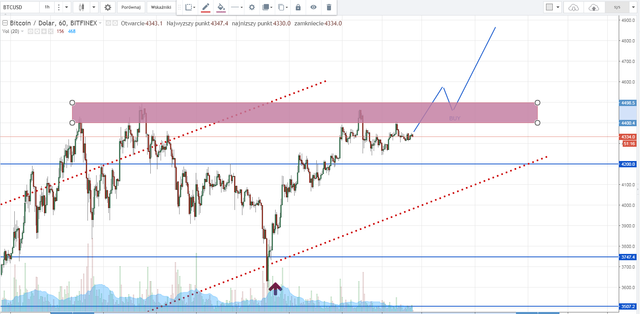
The Bitcoin price, after reaching resistance at 4400 USD and the formation of the double peak, went through a correction phase. It reached as we assumed the lower limit of the growth channel, which coincided with the 3747.5 USD support level. This confluence directed the price back to around 4400 USD. The chart shows the scenario of that week, although the price did not touch again 4200 USD, not giving a signal to buy. In addition, the price increase was on a decreasing volume, which is not a good friend of shopping spots.
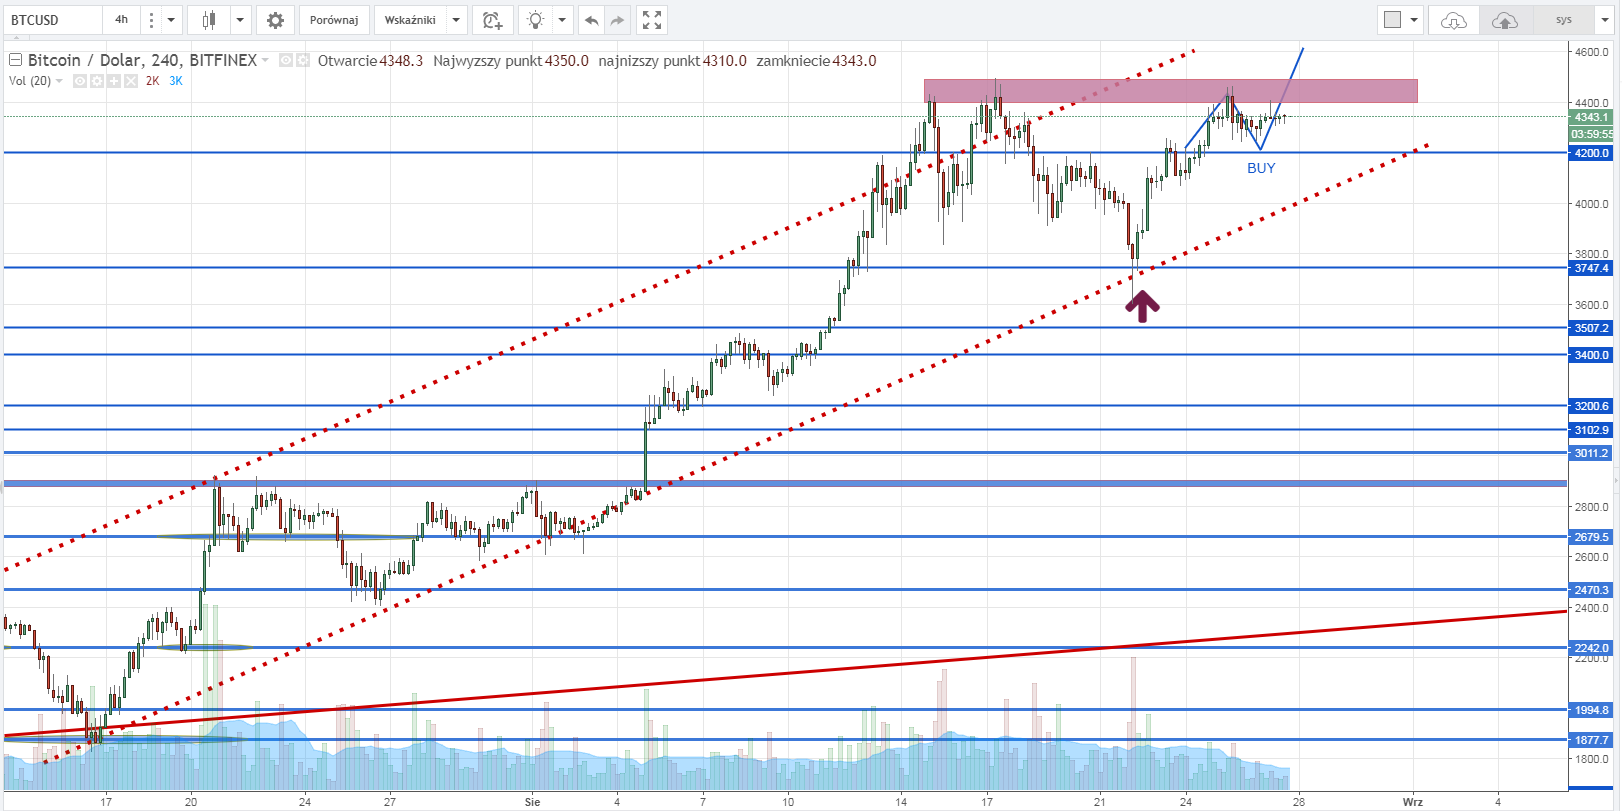
In addition, looking at the chart, it is easy to see that 4200 is no longer a key resistance. So we have highlighted a new growth scenario - the test and defeat of resistance from the top marked with the red rectangle (zone 4400-4500 USD) will be another signal for taking a long position.
At the moment we deliberately do not mark sales scenarios because it is too early to say that the trend has changed - you need to observe the behavior of the price and react when the opportunity arises.
Congratulations @jpktraders! You have completed some achievement on Steemit and have been rewarded with new badge(s) :
Click on any badge to view your own Board of Honor on SteemitBoard.
For more information about SteemitBoard, click here
If you no longer want to receive notifications, reply to this comment with the word
STOP