Technical analysis Bitcoin BTC/USD - 13.08.2017
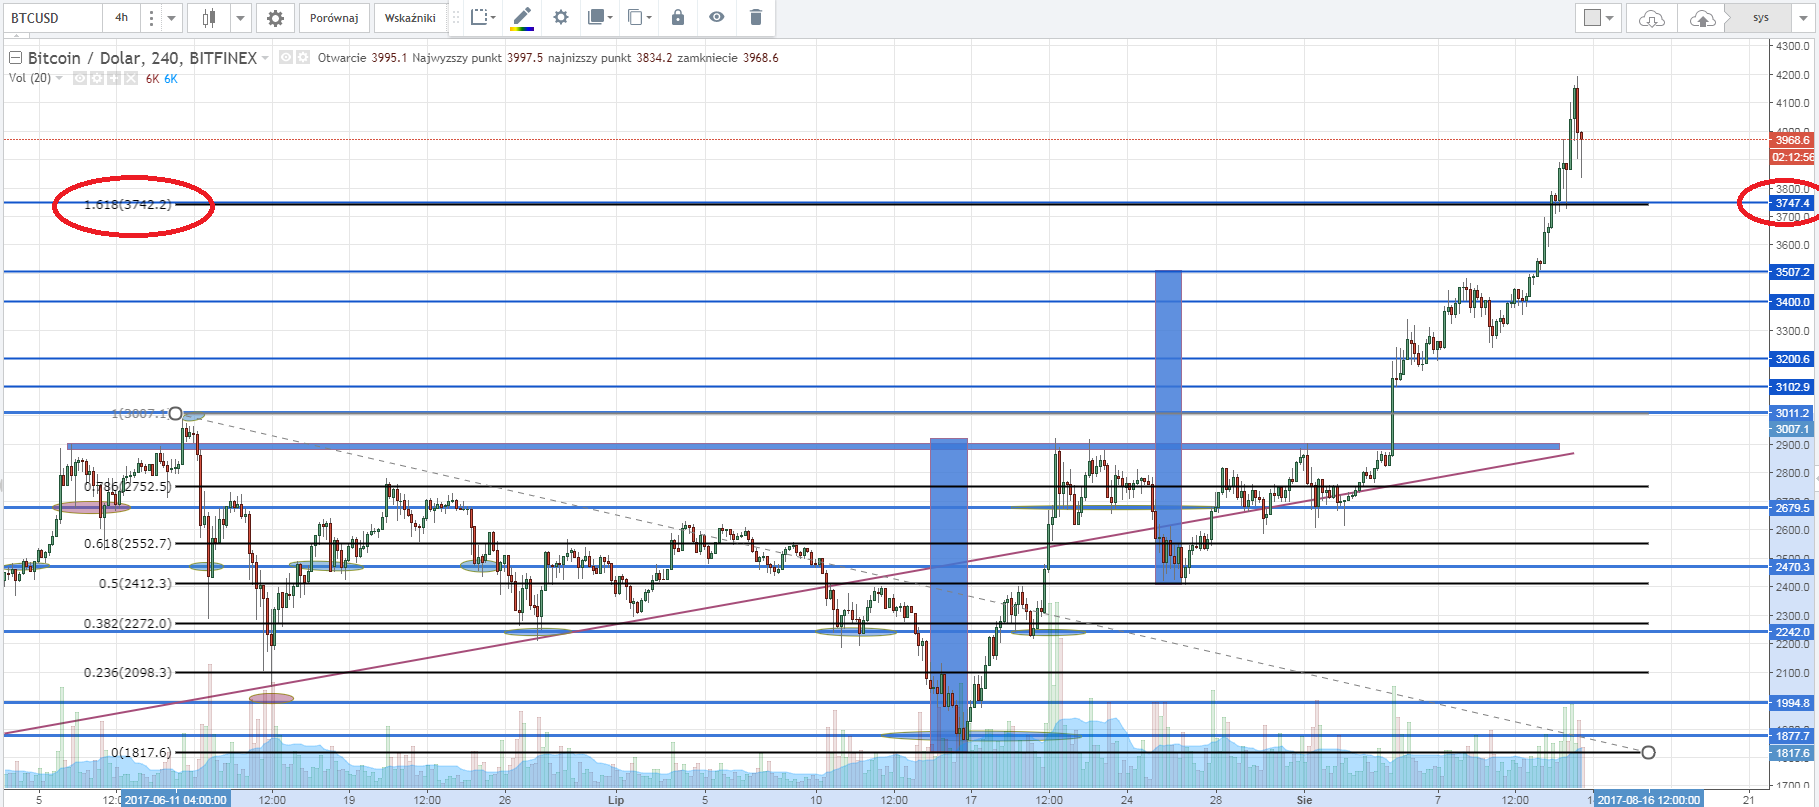
Bitcoin exchange rate gets new heights. It has reached range of 1 to 1 reported by us in a previous analysis at $ 3,500. The price even reached the end of 161% of the last correction from the 4-hour chart - $ 3747.5.
Looking at the chart from the D1 interval you can see a strong upward trend. The previous correction reached 50% Fibo levels, where another growth impulse started.
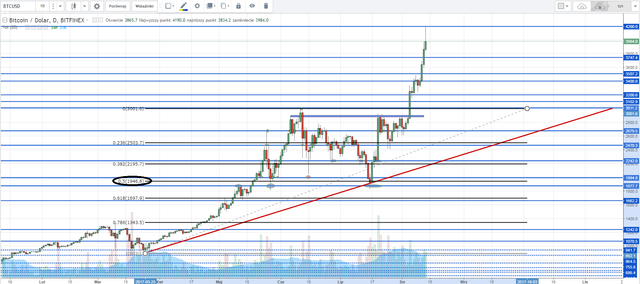
If $ 4200 is the end of another growth impulse, if the correction is also to 50% Fibo, the target will be around $ 3,000, which in turn would fit nicely into the retest of the last hights.

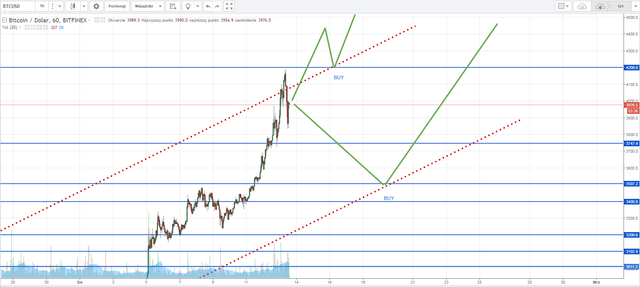
At the lower interval of time it is noted that the course is currently moving in the growth channel and reached its upper limit, where theoretically the correction should start.
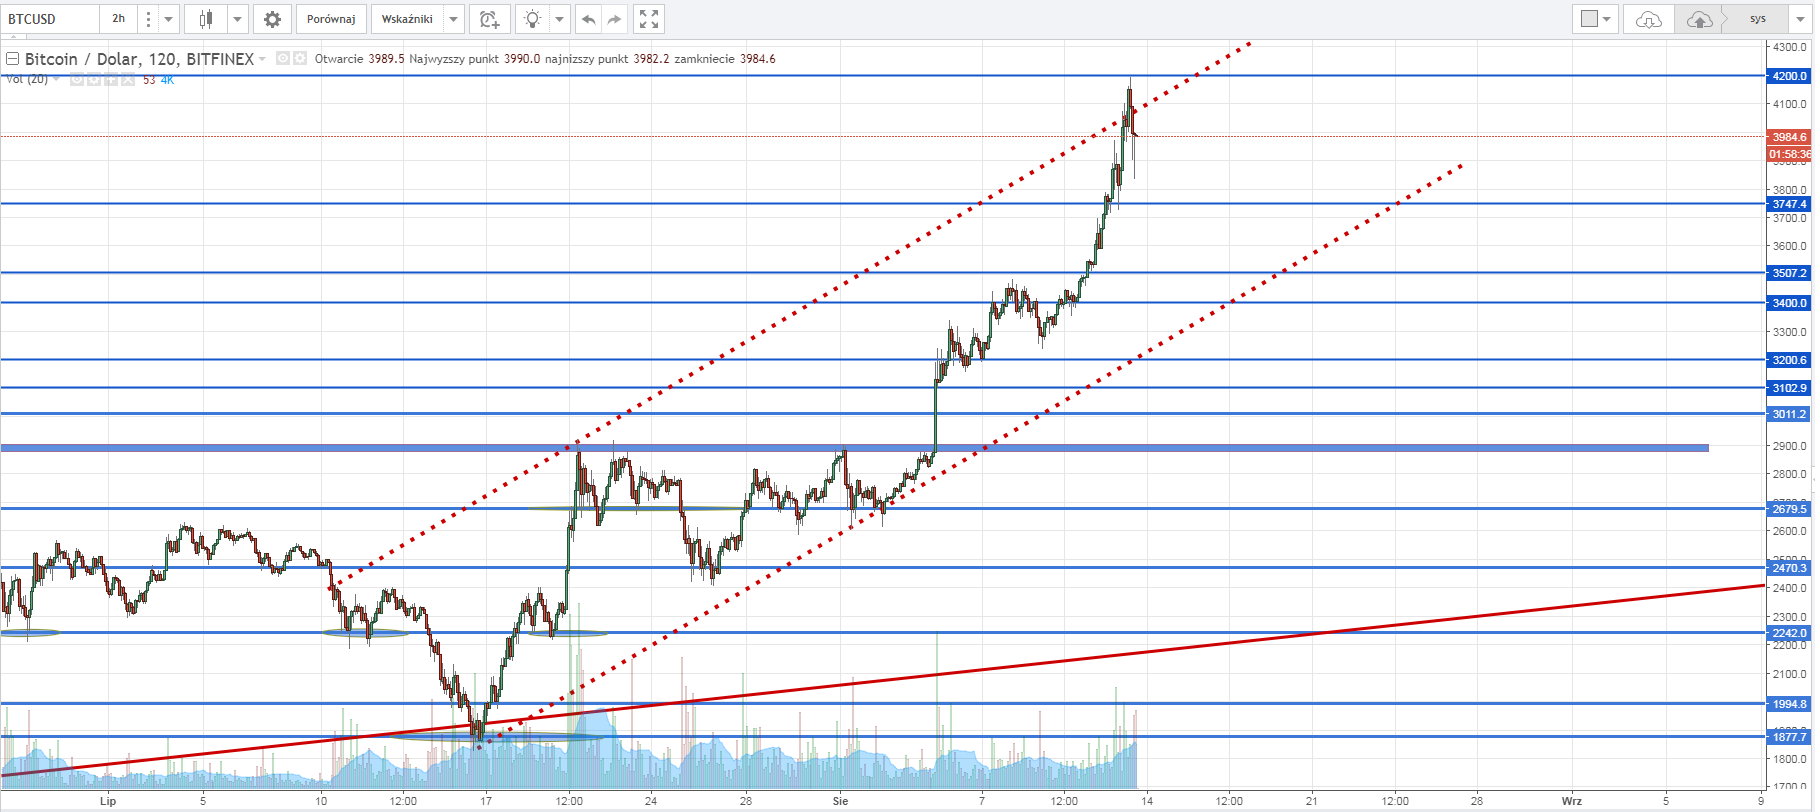
Below scenarios for the coming days.
Buy after rebound and retest of resistance at $ 4200, or buy after correction and reaching the lower limit of the growth channel at around $ 3,500. Sales only after the support has been withdrawn on the previously mentioned level of 3000USD.
Interesting Analysis. My thoughts are similar.
Interesting post... help me to invest in bitcoin and treading. please keep post with other coins also
very nice analysis. The last high of 3000 for a new low sounds likely scenario now that I look at it. However I think this new ath pushed a lot of sceptics over the edge of buying and holding, wich might keep the price higher. Following you for your insights :).
Thanks