When to take profits in cryptos, understanding parabolic moves
Cryptocurrencies tend to move in very quick strong moves upwards which often correct or crash strongly, leaving many traders wondering what happened. In trading one important aspect to understand is knowing the pattern, patterns tend to perform often with similar results, due to the reactions of traders that are shaping the price formation of a chart. This is not specific for crypto currencies, it applies to any trading asset.
What is parabolic move?
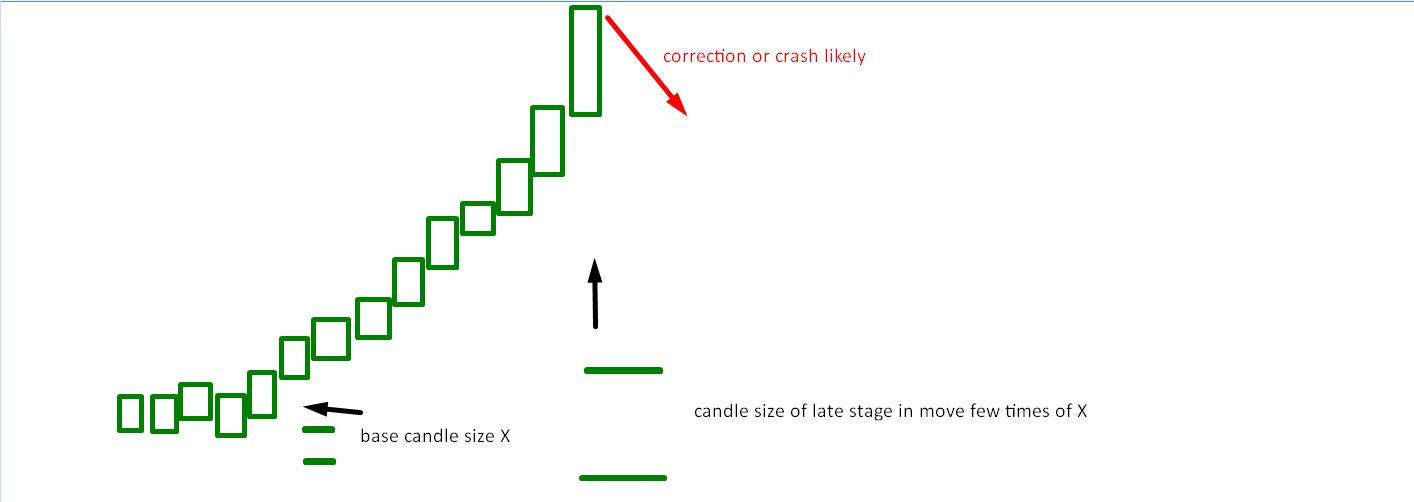
Parabolic move would be move on asset that has specific movement behavior that is also time relative in what kind of time period this move has happened and the initial power of move from base versus the power of move in later stages of move when price is trading much higher. Parabolic moves tend to start as slow upward move that is gaining more and more strenght the higher it goes. Usually this means that the move will be the strongest right around the peak before it crashes, in charts this can be simply measured by volatility. In simpler words for those with little experiance in technical analysis, it means that candle sizes on chart in initial stages of move are small and as the move progresses higher the candles are expanding in size, sand in later stages those candles become much larger than initial candles in base of move.
Conceptual representation of parabolic move:
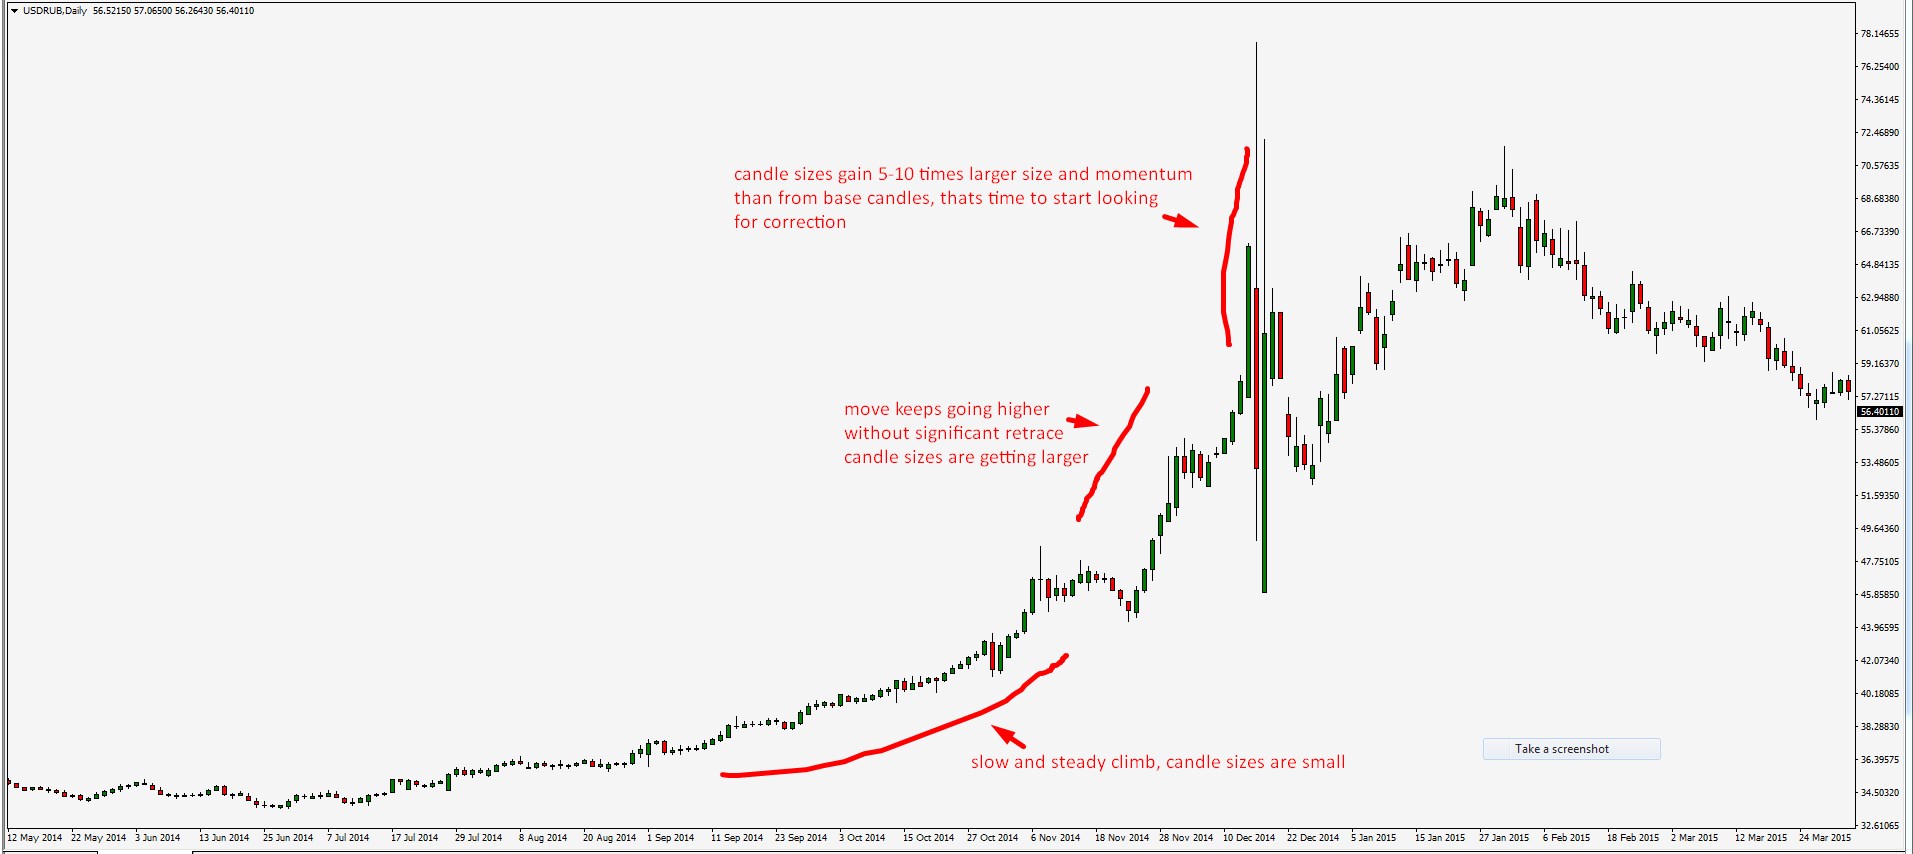
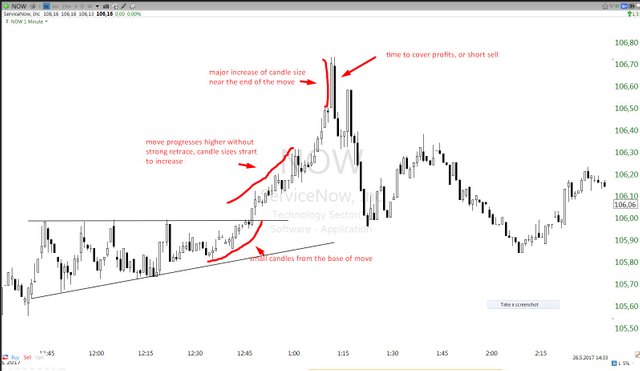
Here are some examples of parabolic moves across different assets, again its not the type of asset that matters its the reaction of traders and investors behind it.
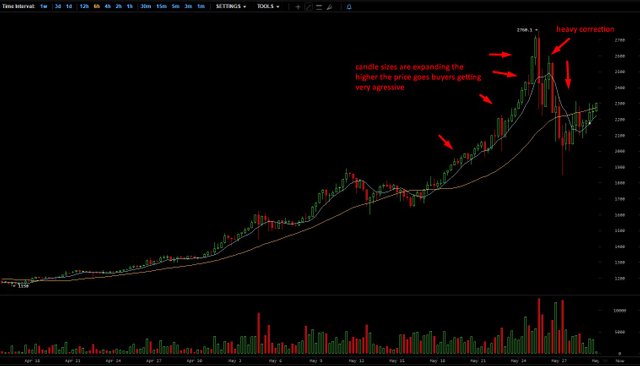
Majority of traders tend to make mistake buying on heavy extended move that is just about to correct or not selling their profits thinking it will go much higher.
Very important aspect is to identify parabolic move really as parabolic move and not just general move where price went higher. Just because price goes up 100% it does not mean that it is in parabolic move.
What identifies parabolic move where price is likely to drop strong is specific variables:
1.Candle sizes in base of move are much smaller than the candles at the peak of current highs.
2.No significant retraces of price on the way up, basically price is grinding up stronger and stronger.
3.Social media, if one checks posts for this specific asset and you see crazy predictions like "its about to go above 10.000 very soon", thats usually additional confirmation that you are looking at parabolic move ready to correct downwards.
When trader or investor identifies parabolic move that is the time to close profits or to look for short on asset.
Welcome to Steemit. Very interesting post.
Welcome to Steemit!
Thanks for the post! I can't find how much is the average % of retrace for parabolic moves. Do u maybe have that data, or something from ur experiences?