Trading Lessons - TA (Technical Analysis) - Indicators - Guppy Multiple Moving Average (GMMA)
Guppy Multiple Moving Average (GMMA) allows the trader to understand the market relationships shown in the chart and so select the most appropriate trading methodology and the best tools. It is designed to understand the nature of trend activity. So this indicator can be used when there is a trend. If there is no trend then this tool is not useful.
The Guppy Multiple Moving Average (GMMA) indicator is based on the relationships between groups of moving averages. Each group of averages in the GMMA provides insight into the behavior of the two main groups in the market – traders and investors.
To track the activities of the traders, we use short term moving averages: 3, 8, 10, 12 exponential moving averages (EMAs).
To track the activities of the investors, we use the long term moving averages: 30,35, 40,45, 50 exponential moving averages (EMAs).
These EMAs are the standard EMAs used in GMMA. I would suggest to include 200 and 300 EMA to the long term moving average basket since there are more reliable.
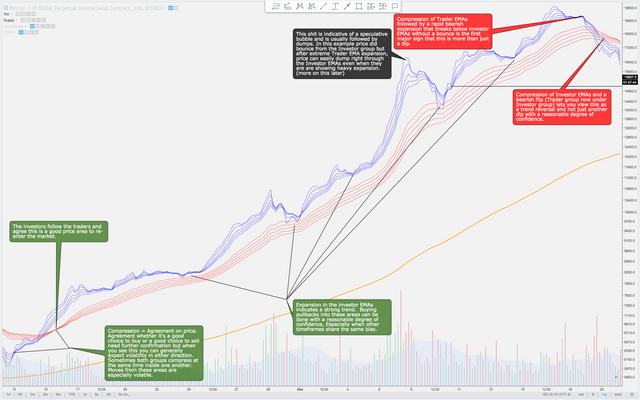
Any changes in trend is always led by traders. When they buy it pushes the prices high in anticipation of a change in trend. But the trend will sustain only if the other buyers enter the market.
Strong trends will be supported by long term investors. The investors takes their time in making sure that the trend will sustain and then take part. The investors will follow the path set by the traders.
If you use trading view platform then you can use this script:
study(title="Guppy", shorttitle="GMMA", overlay=true, scale = scale.right)
//EMA 3//EMA3len = input(3, minval=1, title="Length")EMA3src = input(close, title="Source")EMA3 = ema(EMA3src, EMA3len)plot(EMA3,title='EMA3',color=#3399FF,style=line,linewidth =1)
//EMA 5//EMA5len = input(5, minval=1, title="Length")EMA5src = input(close, title="Source")EMA5 = ema(EMA5src, EMA5len)plot(EMA5,title='EMA5',color=#008ae6,style=line,linewidth =1)
//EMA 8//EMA8len = input(8, minval=1, title="Length")EMA8src = input(close, title="Source")EMA8 = ema(EMA8src, EMA8len)plot(EMA8,title='EMA8',color=#008ae6,style=line,linewidth =1)
//EMA 10//EMA10len = input(10, minval=1, title="Length")EMA10src = input(close, title="Source")EMA10 = ema(EMA10src, EMA10len)plot(EMA10,title='EMA10',color=#008ae6,style=line,linewidth =1)
//EMA 12//EMA12len = input(12, minval=1, title="Length")EMA12src = input(close, title="Source")EMA12 = ema(EMA12src, EMA12len)plot(EMA12,title='EMA12',color=#008ae6,style=line,linewidth =1)
//EMA 30//EMA30len = input(30, minval=1, title="Length")EMA30src = input(close, title="Source")EMA30 = ema(EMA30src, EMA30len)plot(EMA30,title='EMA30',color=red,style=line,linewidth =1)
//EMA 35//EMA35len= input(35, minval=1, title="Length")EMA35src= input(close, title="Source")EMA35= ema(EMA35src, EMA35len)plot(EMA35,title='EMA35',color=red,style=line,linewidth =1)
//EMA 40//EMA40len = input(40, minval=1, title="Length")EMA40src = input(close, title="Source")EMA40 = ema(EMA40src, EMA40len)plot(EMA40,title='EMA40',color=red,style=line,linewidth =1)
//EMA 45//EMA45len = input(45, minval=1, title="Length")EMA45src = input(close, title="Source")EMA45 = ema(EMA45src, EMA45len)plot(EMA45,title='EM45',color=red,style=line,linewidth =1)
//EMA 50//EMA50len = input(50, minval=1, title="Length")EMA50src = input(close, title="Source")EMA50 = ema(EMA50src, EMA50len)plot(EMA50,title='EM50',color=red,style=line,linewidth =1)
//EMA 300//EMA300len = input(300, minval=1, title="Length")EMA300src = input(close, title="Source")EMA300 = ema(EMA300src, EMA300len)plot(EMA300,title='EMA300',color=yellow,style=line,linewidth =2)Examples:
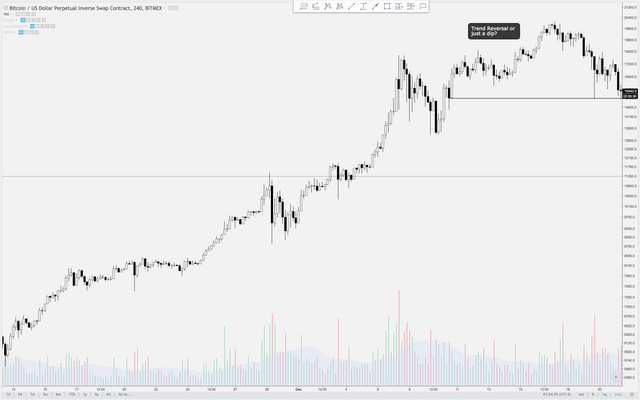
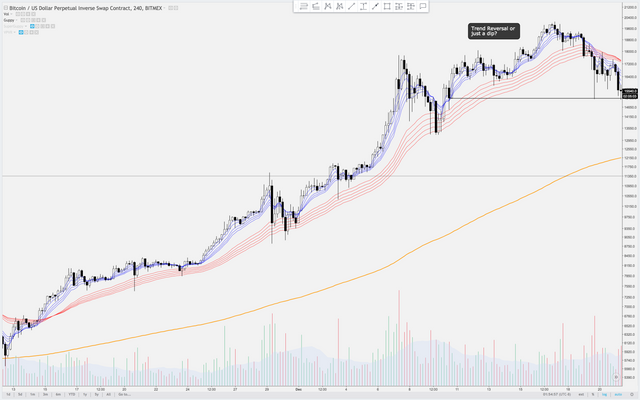
Example 1 - Trend reversal or just a dip???
With GMMA:
Explanations:
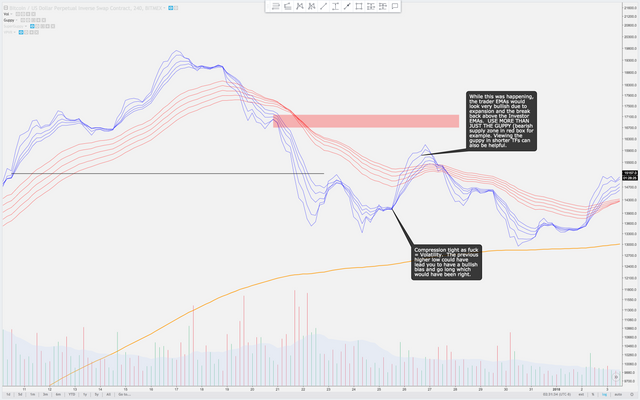
Tip: To reduce being influenced by the candles you can first view the GMMA alone without the candles since this way you can concentrate on the activity of the EMA itself. But be careful because using GMMA along can also lead to some trouble as shown in the below chart. The lesson is to use GMMA as a supplementary indicator so that you can get a better edge in your trading activities.
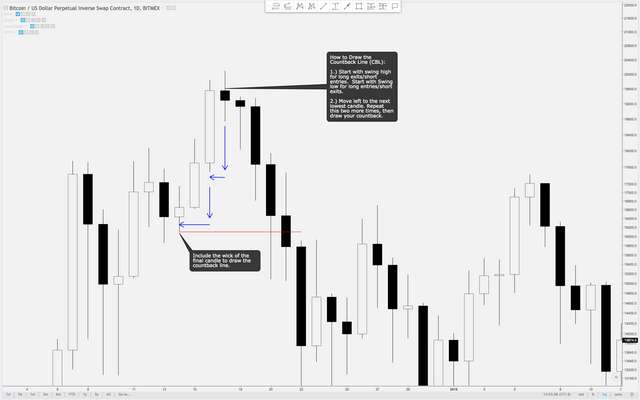
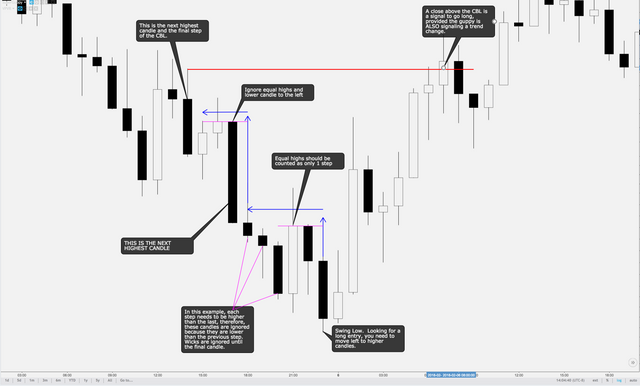
Final part of the GMMA would be the Guppy Countback Line (CBL). The Guppy CBL can be used to decide trailing stop or entry/exit.
That's it for now.
Congratulations @glenden, you have decided to take the next big step with your first post! The Steem Network Team wishes you a great time among this awesome community.
The proven road to boost your personal success in this amazing Steem Network
Do you already know that awesome content will get great profits by following these simple steps, that have been worked out by experts?