Trading Ideas #170630 - OIL Stepping Down Intraday After Daily Resistance Holds
I've been talking about OIL a bit over on Twtitter, so I'll get my thoughts down in a bit more detail on the blog.
Here's what my daily chart looks like:
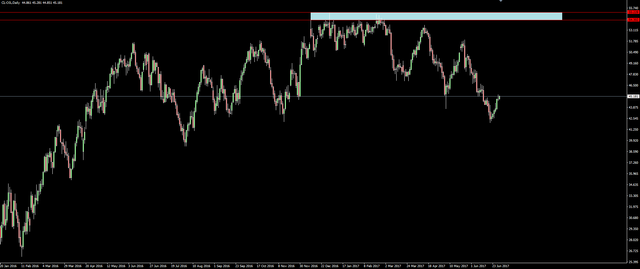
Here you can see that higher time frame resistance has obviously capped price on the daily. As long as price is below this level, I will definitely be maintaining a bearish bias.
Why fight the market if you can join it!
Let's take a step down and have a look at a 4 hourly chart:
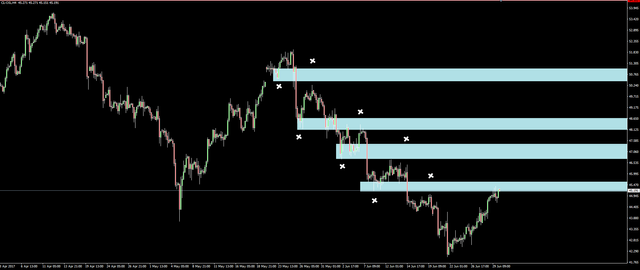
After higher time frame resistance holds, I like to trade the simple stepping down pattern of support forming, support being retested as resistance and then finally price rejecting lower again.
If I can pick anywhere near the top of a retest or be patient enough to catch the momentum on the way down, then I'm laughing.
But now that price is back retesting this level for a second time, I'm starting to think that if it pushes through the zone then it's going to rip higher as it collects all the shorters' stops along the way.
Price action right here, right now in this zone is key whether I want to add into shorts, or get the fuck out.
As always, please share your thoughts, ideas and most importantly include your own charts with what you're looking at in the comments below.
Peace.