Trading Ideas #170628 - BTC/USD Short Zone
This is another series I'm going to run on the Steemit blog. I'm not the kind of guy that's going to hold your hand and give you exact trade setups because I know that if you trade someone else's system without understanding their risk management tolerance and techniques, you can do exactly what they do and still have your account taken to the cleaners.
I instead focus on posting the major, higher time frame levels that we're all watching and intraday trading ideas can be formed in your own mind from there. Social media is invaluable in this regard because the levels are easy, but the pool of ideas and in depth discussions that come around them are where you can really elevate your trading to the next level.
Anyway, please excuse the absolutely disgusting colours on my chart template. I haven't had a chance to get my new crypto trading MT4 platform fully set up. If you follow me on Twitter, you know the format of my charts and the way I analyse markets is so clean, that it doesn't really matter anyway.
So here we have a BTC/USD daily chart. I always start with a higher time frame level that I want to hold so I'm trading in the direction that the market wants to go. If you don't have to push against momentum, then why would you do it to yourself. This is not the gym, this is the market. Don't be a moron.
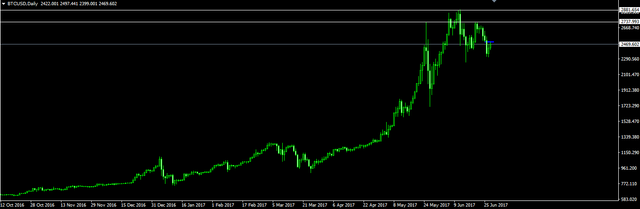
The higher time frame resistance is never going to be perfect here, as it's an all time high after crypto went parabolic. But there's definitely a zone forming and that last touch and push down has confirmed it as having held for me.
Now this is where things get interesting. I've shared the higher time frame level and thoughts on why I think you're better off being short than long. But I want to see your ideas that step from this level. How are you trading BTC/USD on the intraday charts from here?
I'll kick things off on the hourly here.
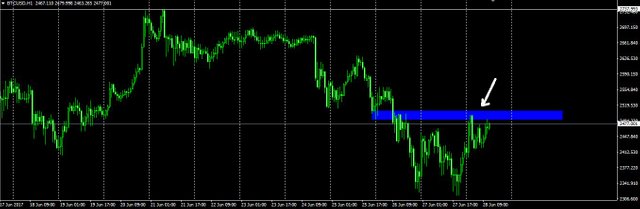
As you can see after price tapped that higher time frame resistance zone, it has traded in a textbook bearish pattern that simply forms short term support, breaks it, then retests it this time as resistance.
That blue level looks pretty juicy to me!
Please share your thoughts, ideas and most importantly include your own charts with what you're looking at in the comments below. Let's do this!