What's a Depth Chart and How to Make Sense of it
Here's my attempt to try to understand a trading depth chart but I would refer to @ozchartart for great technical analysis.
First, what is a Depth Chart?
In order to understand the Depth Chart, you need to understand the Order Book. An order book is an electronic list of buy and sell orders for a specific instrument.
The order book lists the number of shares being bid or offered at each price point, or market depth. It also identifies the market participants behind the buy and sell orders, although some choose to remain anonymous.
The Depth Chart is a graphical representation of all the orders. These can reveal a visual pattern that shows how the market is behaving.
Second, here's an example of a depth chart from Bitcoin/USD price from the order book at Coinbase.
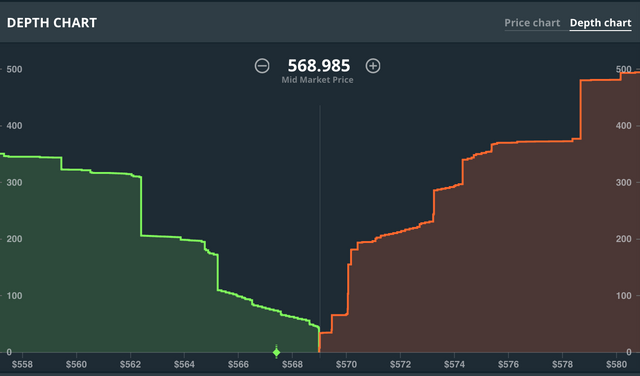
Looking this graphic you can determine a lot. Not only the volume of orders at a given prices (height) but also the horizontality of the market. This can help with determining how broad the price spread might be between orders.
Lastly, looking at the sharp lines for the "angles" of lines can reveal the pressure of any given trading situation (larger/smaller orders) . These angles, if sharp, will drive prices in directions. Sharper angles typically can reveal big gaps between orders and points to ENTER and EXIT.
Furthermore, the depth chart is like a balancing scale. As one side of the scale is "heavier" the price will drift in this direction.
This was my first attempt to provide original interpretation of the Depth Chart. I welcome your comments and guidance on how to read better. Are you on TradingView? Would love to connect with you there too. https://www.tradingview.com/u/Agentbond007/
Thank you.
Thanks a lot !