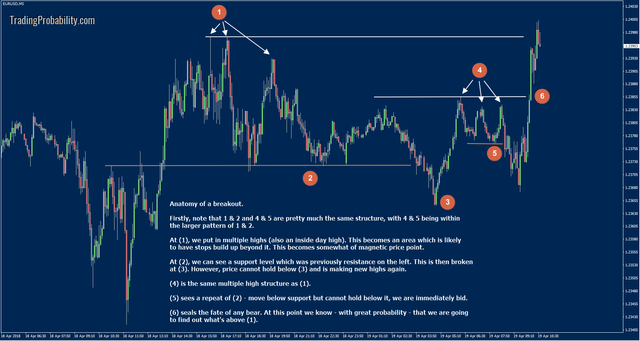
Anatomy of a Breakout - EURUSD: Chart of the Day - 19th April
Anatomy of a breakout.
Firstly, note that 1 & 2 and 4 & 5 are pretty much the same structure, with 4 & 5 being within
the larger pattern of 1 & 2.
At (1), we put in multiple highs (also an inside day high). This becomes an area which is likely
to have stops build up beyond it. This becomes somewhat of magnetic price point.
At (2), we can see a support level which was previously resistance on the left. This is then broken
at (3). However, price cannot hold below (3) and is making new highs again.
(4) is the same multiple high structure as (1).
(5) sees a repeat of (2) - move below support but cannot hold below it, we are immediately bid.
(6) seals the fate of any bear. At this point we know - with great probability - that we are going
to find out what's above (1).
Posted from my blog with SteemPress : https://www.tradingprobability.com/eurusd-chart-of-the-day-19th-april/
