How to trade the Markets understanding Volume Levels
Volume is the only truly leading indicator. Professional traders use volume to determine investors’ interest in the market – it’s their way of understanding accumulation prior to up momentum and distribution prior to down momentum.
Volume Indicator gives you the ability to see professional buying, professional selling and no demand. This insight will give you the ability to trade with confidence.
This immensely powerful indicator performs over three hundred calculations per bar and provides the foundation stone of tools and methodology.
How Volume Trading Works
Trading using volume gives you the following:
Volume confirms the strength of a trend or suggests its weakness.
Rising volume indicates rising interest
Falling volume suggests a decline in interest, or a statement of no interest.
Extreme volume readings, i.e. climax volume, often highlights price reversals.
Points where the market trades on high volume are the points of strong support and resistance.
Breakouts and market spikes can be validated or ignored with the help of volume.
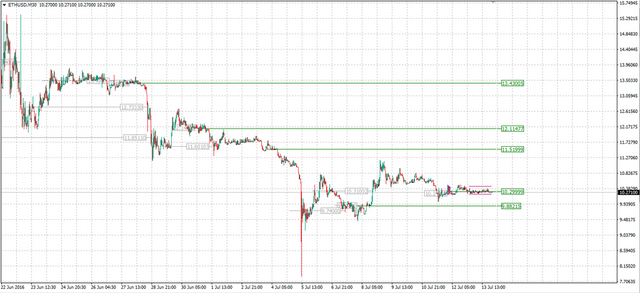
(MetaTrader4 + BTC-E + MarketProfile_VirginpPOC Indicator ETH/USD)
Volume Spread Analysis
In the 1930’s, stock market authority Richard Wyckoff took volume and analysed it until he found a predictive indicator which he called Wyckoff Volume Spread Analysis (VSA). Many of the world’s iconic traders went on to use Wyckoff’s Volume Spread Analysis. Jesse Livermore and JP Morgan were amongst the many wealthy traders that used VSA to great success. Since then it has been acknowledged that VSA is an extremely good leading indicator.
The software takes market volume, and then compares it to a number of other factors, such as each bar’s open and close, and the range of a specific number of preceding volume levels.
Volume is the second most valuable item of data after the price itself. Large volume signifies that there are a large number of market participants involved in the price action, including financial institutions, who bring the highest turnover to the market. If the financial institutions are trading, it means they are interested in a price at certain level and they literally push the price up or down.
Low volume tells us that there are very few participants in the market, and that neither buyers nor sellers have any significant interest in the price. In this scenario, no financial institutions will be involved, and therefore any moves from individual traders will be weak.
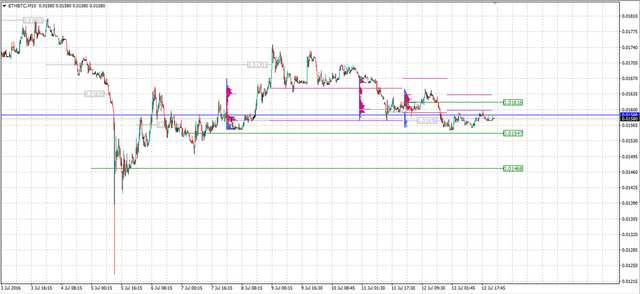
(MetaTrader4 + BTC-E + MarketProfile_VirginpPOC Indicator ETH/BTC)
Volume and Trend
Volume helps us to determine the health of a trend. An uptrend is strong and healthy if volume increases as price moves with the trend, and decreases when the market moves into a counter trend. These are called correction periods or ‘pull backs’.
When prices are rising and volume is decreasing, it tells traders that a trend is unlikely to continue. Prices may still attempt to rise at a slower pace, and once sellers take control (which is shown by an increase in volume on a down bar), prices will fall. A downtrend is strong and healthy if volume increases as prices move lower and decrease when the price begins to re-trace (pull back) upwards. When a market is falling and volume is decreasing, the downtrend is unlikely to continue. Prices will either continue to decrease, but at a slower pace or stop falling and start to rise.
Volume and Reversals
When volume spikes at certain price levels, professional traders know that this is a clear signal of increased interest being shown by traders at that price level. If there is significant interest, as revealed by the volume bar, it means the level is an important one. This simple observation of volume allows traders to identify important support and resistance levels which are likely to play a significant role in the future.
Where volume spikes are extreme, larger than any historical spikes, and generally called a volume climax, traders should look for reversal clues from the price itself. Single volume spikes alone can often bring the market to an abrupt halt. These extreme volume spikes often occur during fundamental economic announcements which occur daily. News can cause a spike in volume for a single day then disappear again. Reversals, however, happen not over a single day but over a series of days. If higher than average volume stays in the market for several days a huge volume spike, a volume climax, will often signal a point of market reversal.
Volume and Breakouts
Volume can help to validate all kinds of breakouts. When the market is consolidating on low volume, an increase in volume can signify that a breakout is due. A breakout occurring on rising volume is a valid breakout, while a breakout with low volume is more likely to be false. Why? Simply because the lack of volume signals a lack of interest from the market and traders.
Trend lines and other breakouts are validated or voided in exactly the same way. So as you can see volume is without question the most important and powerful indicator of all. It is remarkably accurate at predicting future moves. When you start to incorporate Volume Price Analysis in association with a volume indicator, you then have an amazing trading tool at your disposal.
Summary
Volume after all is the fuel that drives the market, both higher and lower. If there is no volume, then the market is unlikely to move far. It takes effort for a market to move, either higher or lower, and if there is no effort or volume, then the market will move into sideways consolidation, and only break out once volume increases significantly. This is the power of Volume Spread Analysis.
Some of the greatest traders who have ever lived such as Jesse Livermore, W D Gann, Richard Wykoff and Richard Ney all used this technique as the cornerstone of their own trading philosophy. They understood the power of using volume and price action, and it allowed them to succeed, where so many traders had failed.
Now, at last, with the unique volume algorithm, we finally have the tools to truly see inside the market, and to trade with confidence, knowing that we are trading WITH the trend and the money flow, rather than against it.
Volume allows us to see, and rather than motoring through a sea fog, hoping to avoid an accident, the volume indicator gives us our own unique radar system to safely navigate in the markets.
It is the ultimate indicator, increasing exponentially our trading success, our confidence, and our analysis of risk on each and every trade. Without it, trading is a lottery. With it, you potentially have the winning ticket.
Just as with every other indicator, the Volume tool works across all the time frames from intraday time and tick based charts for scalping strategies, to longer term daily and weekly charts for trend traders.
Indicator works in all markets and can be used in all time frames for both tick and time charts — from longer term swing and trend trading on daily and weekly charts, down to fast scalping on an intra-day basis, using minute or tick charts.
Indicator for MT4 http://dropmefiles.com/jQpNP
Good explanation, sometimes I spend so much time looking for technical indicators I forget about the simple things, like volume.