Litecoin (LTCUSD)technical analysis: Patience required before you buy
The Daily timeframe of Litecoin (LTCUSD) as shown in this analysis captures price from January 6, 2018 to present date as operating inside of a falling diagonal (wedge) chart pattern i.e. #1 as indicated on the chart.
The latest test and confirmation of the falling wedge occurred on August 14, 2018 at ~$49.14.
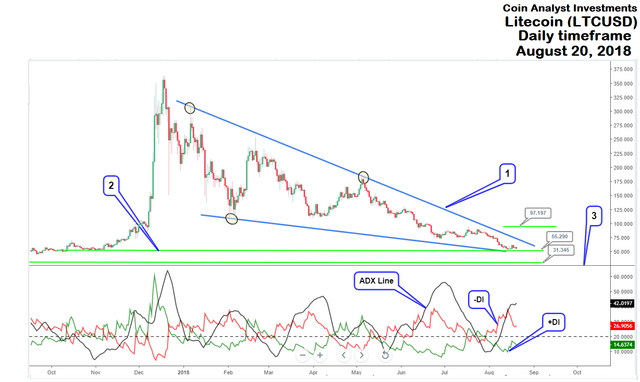
Any bullish trade inside of the wedge is considered an early entry and more aggressive, compared to long (buy) entry orders placed on a break outside of the wedge. The horizontal line at $97.20 is shown here as a conservative point of entry as it ensure a price close outside the wedge that also indicates a potential bullish move for LTCUSD.
~$55.29 and $31.35 (#2 marked on the chart) is expected to provide support for Litecoin and a break below the bottom of support could see Litecoin reach between $20 and $10.
The Average directional index (ADX) as shown here (i.e. #3) indicates that the strength of the bearish trend is not letting up.
Interested in Ripple(XRPUSD)? Check out the free analysis below.
https://steemit.com/cryptocurrency/@cryptotrader0029/ripple-xrpusd-how-to-profit-from-the-4hr-tf-chart-pattern
Besides, chart analysis of Bitcoin can be found here:
https://coinanalyst.investments/2018/08/15/bitcoin-analysis-today/
Good analysis, I'll be glad if You check our site - BlockchainMuffin.com - https://blockchainmuffin.com/
I just checked out your website and thanks for your kind words:-)