GDX Analysis(VanEck Vectors Gold Miners ETF): Bullish Move Not Yet Over?
Conclusion for today’s GDX analysis: Price closing above 26.17 implies resumption of the current uptrend in GDX.
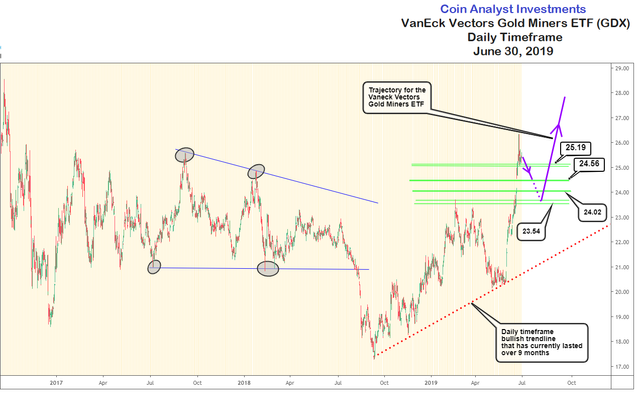
The VanEck Vectors Gold Miners ETF (GDX) is presented on the Daily timeframe with coverage of over 24 months of price action. The sell off and bearish market in the GDX that began in August of 2016 (not show here), continued until September 11, 2018 after which price failed to establish lower lows and lower highs.
Instagram: https://www.instagram.com/coin_analyst/
Twitter: https://twitter.com/Cryptotrader029

A bullish trendline in GDX that has lasted over 9 months is used to highlight the current trend in the ETF ever since the September 11, 2018 price low of 17.28. The current bullish price swing from the last pivot on the trendline (at ~20.17) reached a peak of 26.17 where price is currently consolidating.
Horizontal lines of support are drawn on the chart where the ETF is expected to use a pivot to resume the bullish trend. They key levels therefore are 25.19, 24.56, 24.02, and 23.54.
The trajectory anticipated for price action is also provided. Failure of support at 23.54 increases the chances of price returning to the bullish trendline prior to resumption of the uptrend.
Our previous Bitcoin analysis (BTCUSD) before the current price rally was also posted for FREE and can be found below.
https://coinanalyst.investments/2019/04/26/btc-analysis