GBPCAD (Forex) Technical Analysis: Important info. To keep in Mind for the Week of Feb. 03, 2019
Conclusion for today's GBPCAD (FX) analysis:
A break below the channel and also below 1.65930 could see the GBPCAD accelerate in bearish momentum. Minimum target in this case is the width of the channel projected downwards.
The 6 hour timeframe of the GBPCAD is shown in this analysis with over 8 months of price action. Primary focus of this analysis is the channel identified in the GBPCAD that has lasted over 4 months.
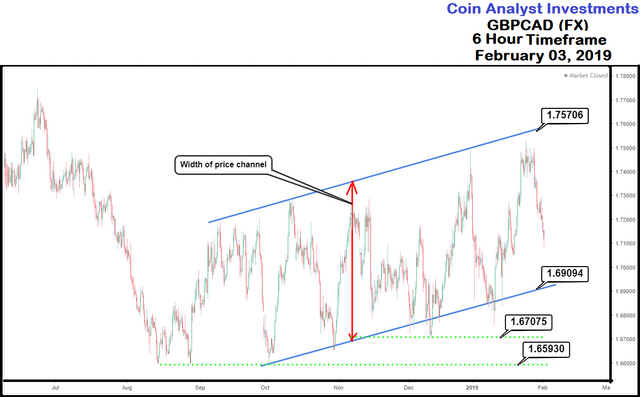
1.75706 and 1.69094 indicate the extremes of the channel with the former being the upper boundary and the latter representing price level for the lower boundary. The most recent market action up to Friday close last week was a price swing downwards after bullish momentum failed to carry price above the upper boundary of the channel.
The lower boundary of the channel thus presents the least or minimum target that can be anticipated for the GBPCAD. A break below the lower boundary and especially below 1.65930 (lower boundary of horizontal support in green dotted lines) could see the GBPCAD accelerate in bearish momentum. Minimum target in this case would be the width of the channel projected downwards.
Interested in the Ethereum Analysis (ETHUSD)? Check out our previous analysis below:
https://coinanalyst.investments/2019/02/02/eth-usd/