#19 - What is the Hunt Volatility Funnel? (HVF)
Hey guys!
In this post I'm going to discuss the trading method I have been using for the past couple of months. When I first saw it, it seemed really confusing and almost "made up". At the same time, I believe it is vital for you to have at least a small grasp of how HVF Theory works so you can understand my other posts better.
There are several ways to look at a chart. Besides the multitude of indicators one could use, there are also the so called classical chart patterns that you could look for; and that is the way most people trade. However, what about the actual price action? Is it actually random?
Well, this is statement that traders using HVF Theory would usually disagree with. There is a lot of information that you could take from a chart if you knew how to look at it, in the correct way.
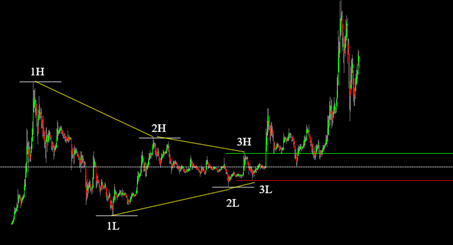
As you can observe in the figure above, you can see a setup which is a HVF. A regular HVF contains three high points and three low points, leading to an eventually tightening of the price behavior; a reduction in volatility. We first have a big impulse from the 1H to 1L points and then a smaller one from 2H to 2L.
Eventually the price action calms down so much that we are able to draw the green and red lines (3H and 3L points, respectively). This zone is referred to the funnel region . Once this levels have been established, if we join the lines we indeed a type of funnel forming as a result of the decrease in the price volatility until it make a sudden decision to go in a given direction.
This process can also be applied when the price is seemingly going down as seen in the picture below:
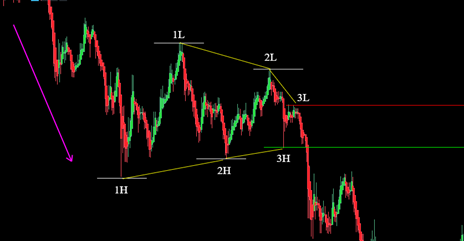
Very similarly we see a reduction in volatility until the price continues moving downwards.
Is a saying Francis Hunt, the creator of this method commonly repeats and you will see it throughout a lot of these blog posts as well. I recommend checking out some of his material on Youtube @:
https://www.youtube.com/channel/UCdC4a2KquFV1F4O21mW3K7g
His drawing are hard to understand at first, but if you watch them enough times you will actually start picking up some things :)
You can also check out his website @:
His private group is very pricey (especially for us regular people) but I have to disclose that it is my current goal to join it. These people are serious about what they are doing and they don't sleep on it.
So this is a summary of what you should attempt to find on a chart next time you look at one. Until then, keep following his channel and this blog for updates where these HVF's are potentially found!

Disclaimer: Cryptocurrency trading is highly speculative in nature which can mean currency prices may become extremely volatile. Cryptocurrency trading carries a high level of risk and may not be suitable for all investors. It is possible that you will sustain a loss of some or all of your initial investment so never risk capital that you cannot afford to lose. You acknowledge and agree that no promise or guarantee of success or profitability has been made between you and BeIndependent.
Follow @Instagram: https://www.instagram.com/beindependentbb/
