Understanding Candlestick Chart
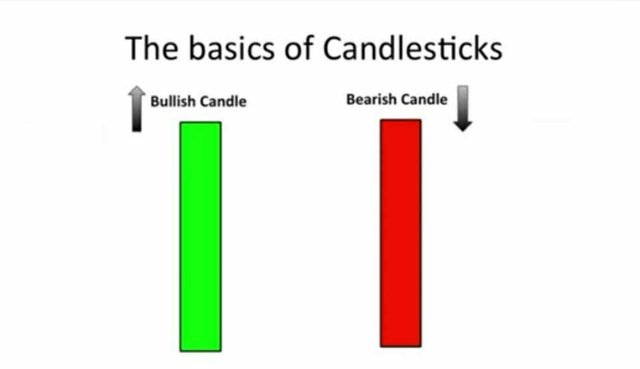
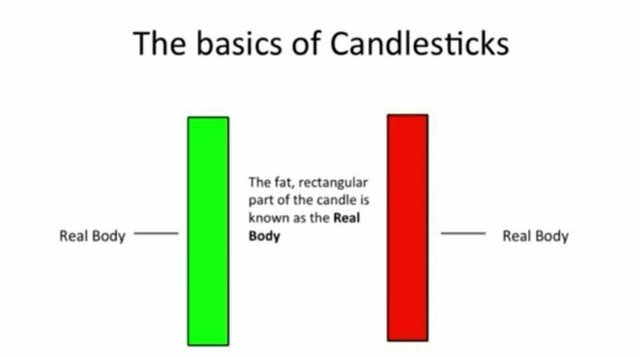
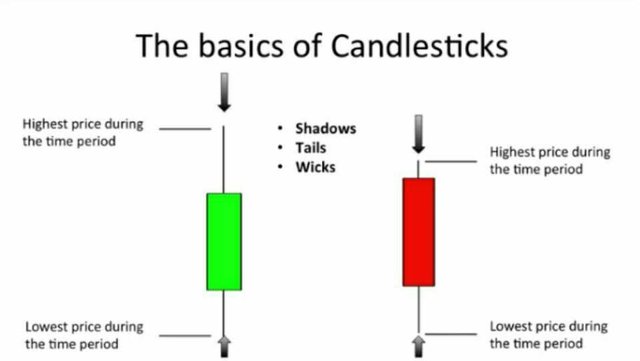
Candlestick is a chart that displays the high, low, opening and closing prices of a security for a specific period. The wide part of the candlestick is called the "real body" and tells investors whether the closing price was higher or lower than the opening price. Black/red indicates that the stock closed lower and white/green indicates that the stock closed higher.
Source
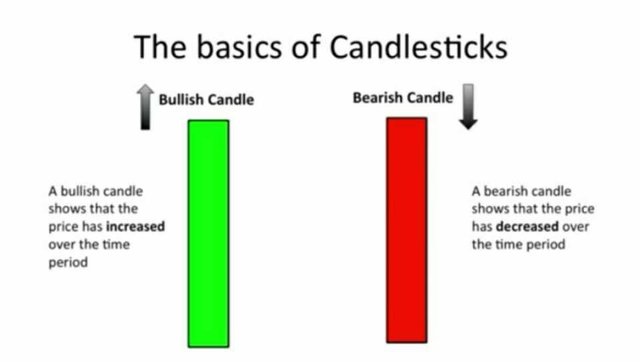
- A bullish candle shows that the price has increased over the time period.
- A bearish candle shows that the price has decreased over the time period.
- The fat, rectangular part of the candle is know as the real body.
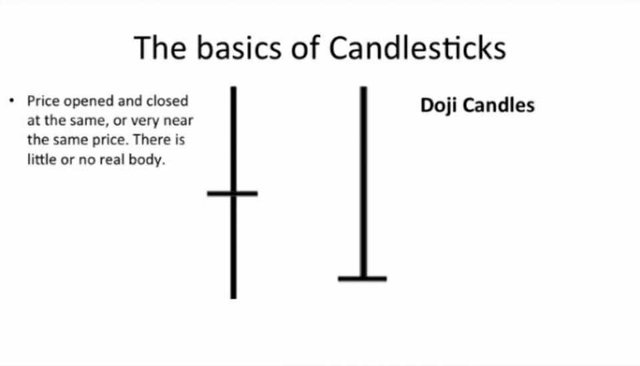
- Price opened and closet at the same, or very near the same price. There is little or no real body.
these are just a few examples to learn about candlestick, hopefully useful.
Thank You
@smartbot tip 1
You will be rewarded 1 SMARTCASH for using this resteem service
ABASINKANGA RESTEEM SERVICE
1 SMART = 0.04 SBD
How To Use SmartCash?
Σ$$$ Tipped @babangkleng
Σ1 SMART! Comment@smartbot helpto claim. Currently the price of SmartCash in the market is$0.129 USDperSMART. Current value of the tip is$0.13 USD. To find out more about SmartCash, please visit https://smartcash.cc.Big Candlestick@babangkleng
Congratulations! This post has been upvoted from the communal account, @minnowsupport, by babangkleng from the Minnow Support Project. It's a witness project run by aggroed, ausbitbank, teamsteem, theprophet0, someguy123, neoxian, followbtcnews, and netuoso. The goal is to help Steemit grow by supporting Minnows. Please find us at the Peace, Abundance, and Liberty Network (PALnet) Discord Channel. It's a completely public and open space to all members of the Steemit community who voluntarily choose to be there.
If you would like to delegate to the Minnow Support Project you can do so by clicking on the following links: 50SP, 100SP, 250SP, 500SP, 1000SP, 5000SP.
Be sure to leave at least 50SP undelegated on your account.