Trading Patterns: Dead Cat Bounce
Sometimes chart patterns and plays have funny names or slogans. The “Dead Cat Bounce” is definitely up there with the strangest. What is a dead cat bounce and why would anyone point to a stock chart and say, “Hey look at that dead cat bounce right there!”
The dead cat bounce play is based off the old saying that even a dead cat can bounce if falls hard enough. But how does this apply to stocks? It’s actually quite simple. It means a stock has dropped in price significantly closing on a low and opening again with a higher entry then the previous close.
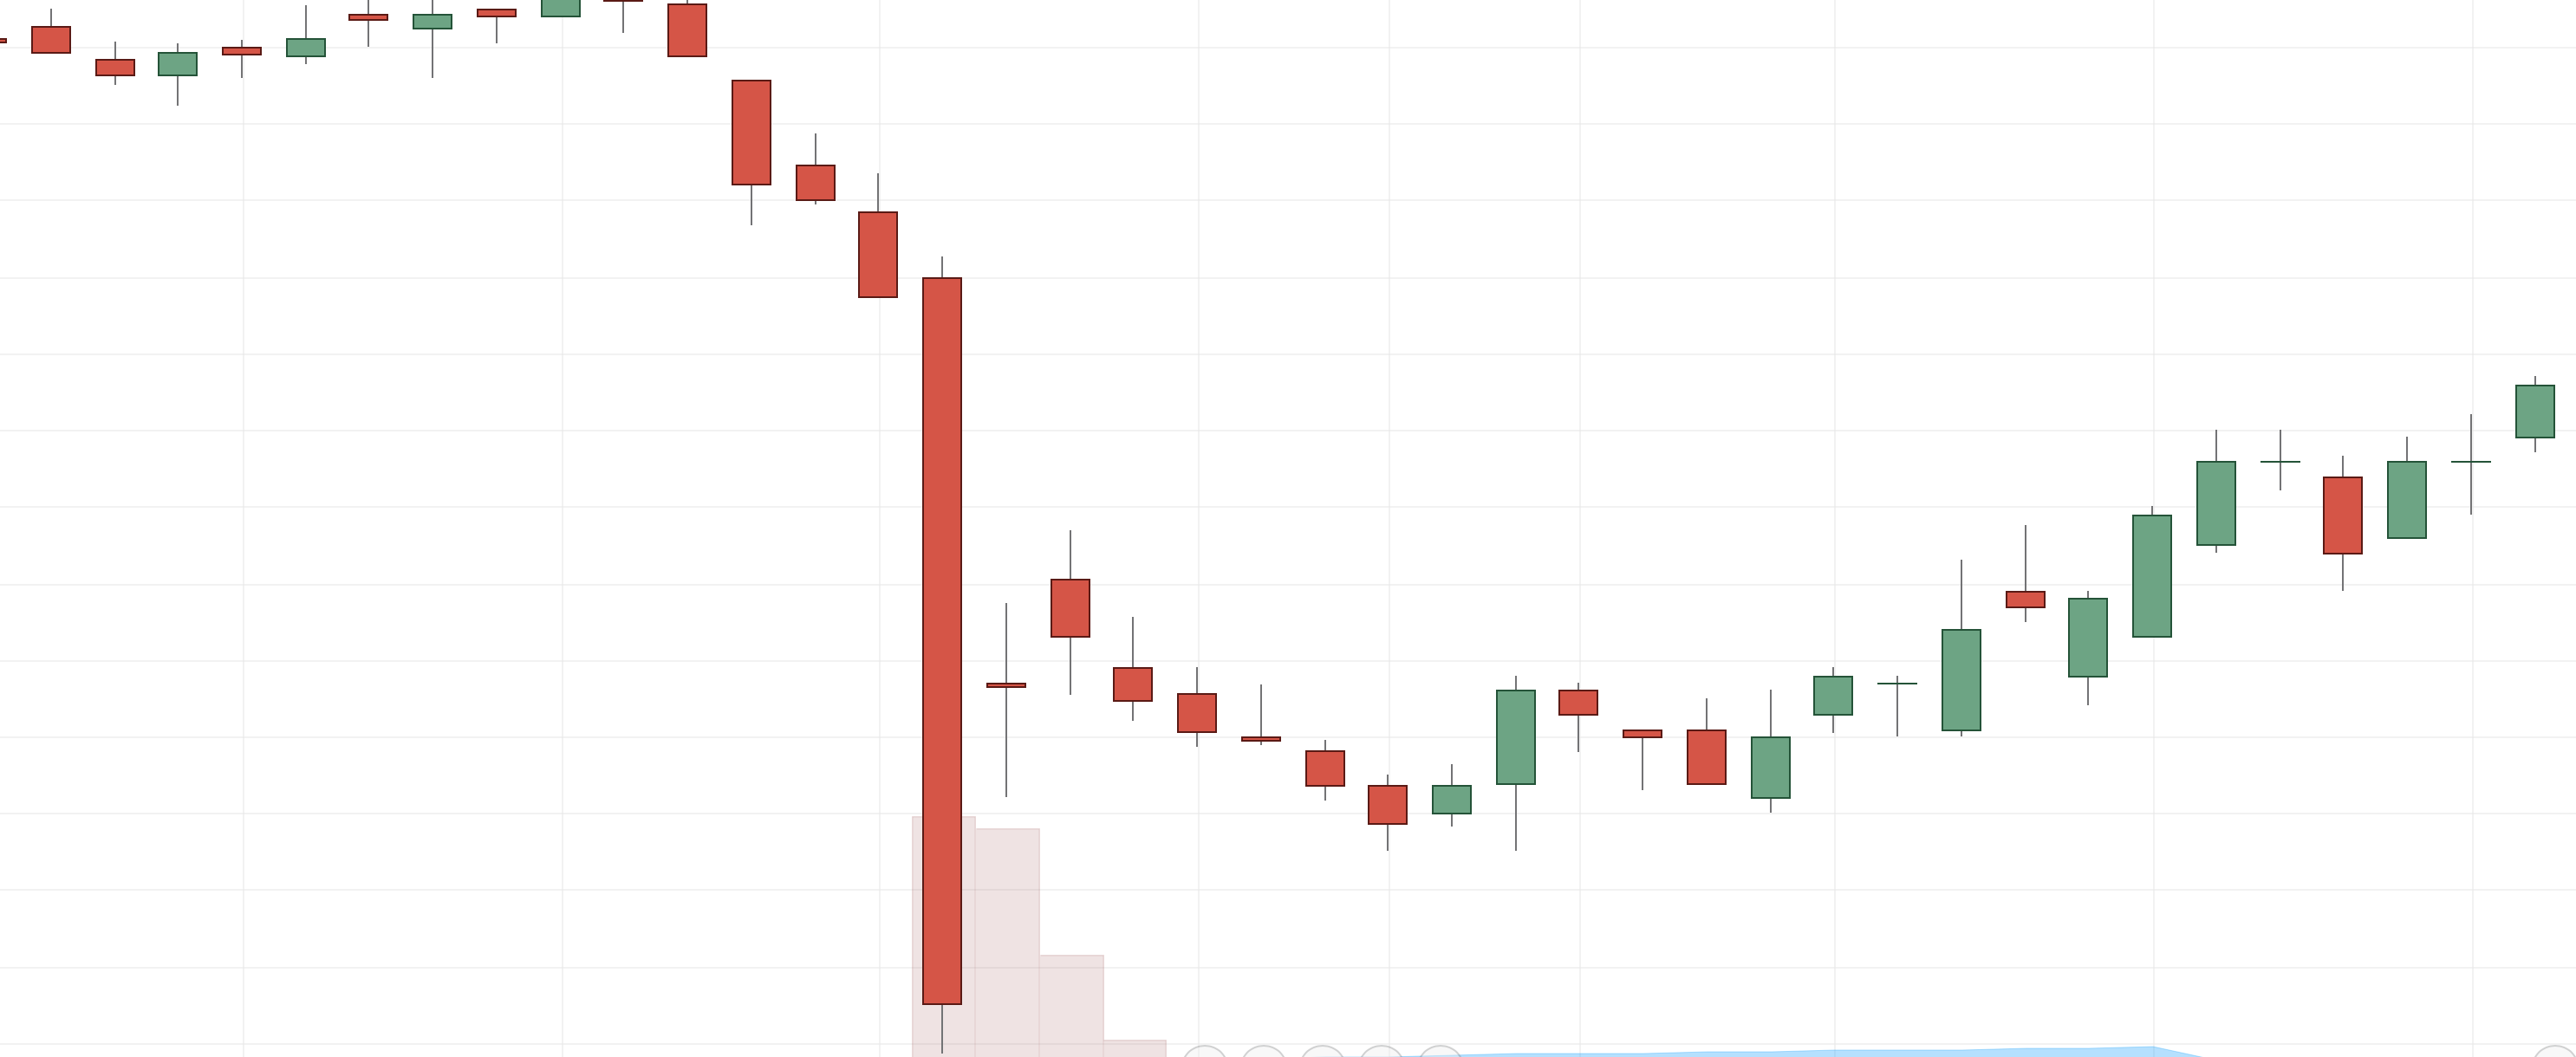
A dead cat bounce signal is quite easy to spot on a candle chart. Simply look for the giant red/bearish candle. These signals can and often occur around earnings reports or other catalysts. Instead of continuing the downtrend a dead cat bounce will occur and the stock will pick back up and start trading above where it last closed. This dip creates an amazing opportunity for traders looking to get in and scalp some quick profit.
Here is a great example of what this looks like on a chart:
As you can see from the chart above the long bearish candle closes much lower than where it opened. The following candles open significantly higher from that close. If the trader enters the trade right after that second candle they may think a bullish uptrend is about to occur. There would have been a few days of questioning that play but eventually, a couple weeks later, it would have paid off nicely.
Depending on the stock and the confidence you have in that particular security the dead cat bounce can be a great opportunity for longs to get into a position with some cheap shares. It’s important to combine as many technical indicators as possible. If the play occurs around earnings then do some due diligence and divert your attention to the fundamentals of the security to see why the earnings performed so badly. This can help you decide if this stock will be a good one to profit from or not.
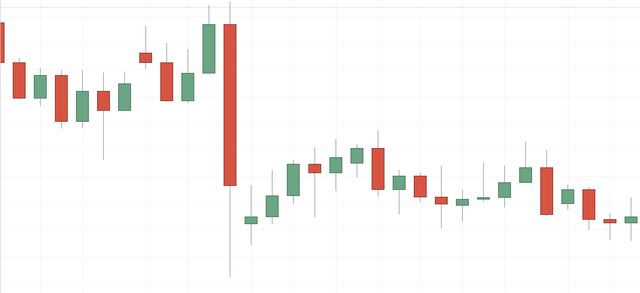
Here is an example below of a much weaker dead cat bounce. As we see the stock had a hard drop and hasn't quite made it back to the original trading levels it was once at before the hard drop. This would have been a tricky one to play because the buyers trading on this specific pattern would likely have bought in at that third candle after the bounce. While, there was a little bit of room for profit we can see theres a dip coming.
These plays must be carefully thought out and before purchasing anything it is the traders responsibility to make sure they understand why the stock dropped in hopes of understanding whether or not it can continue to increase. Remember, when making trades always use a stop loss and protect yourself from taking major losses. You only want to risk 2% of your trading account. Be consistent and know when to exit.
Thanks for reading and good luck out there!


Congratulations @atxtrading! You have completed some achievement on Steemit and have been rewarded with new badge(s) :
Click on any badge to view your own Board of Honnor on SteemitBoard.
For more information about SteemitBoard, click here
If you no longer want to receive notifications, reply to this comment with the word
STOPBy upvoting this notification, you can help all Steemit users. Learn how here!
Thanks for the information. I haven't heard of the dead cat bounce formation yet, but I've seen it play out quite a few times on the CryptoCurrency markets. Upvoted and followed!
Yeah with crypto being so volatile these drops can happen pretty frequently. If you are planning to go long then those are awesome opportunities to buy cheap shares.
Yes, I rarely trade - don't have enough time. I take a long position, buy in the dips and hold. I got in really early, so the market volatility isn't scaring me... yet. There may come a time though.