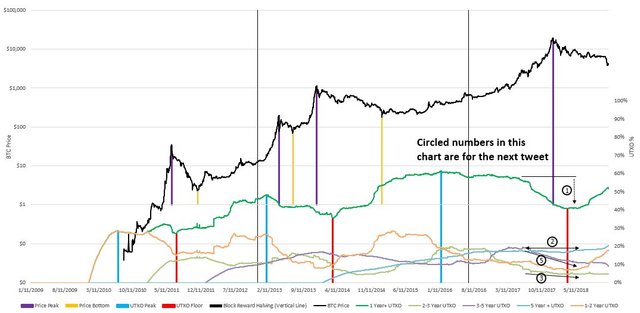
RE: Most Important Bitcoin Chart Ever
Possibly bullish news that the bottom could potentially be formed by summer and VC investment is pouring into our sector:
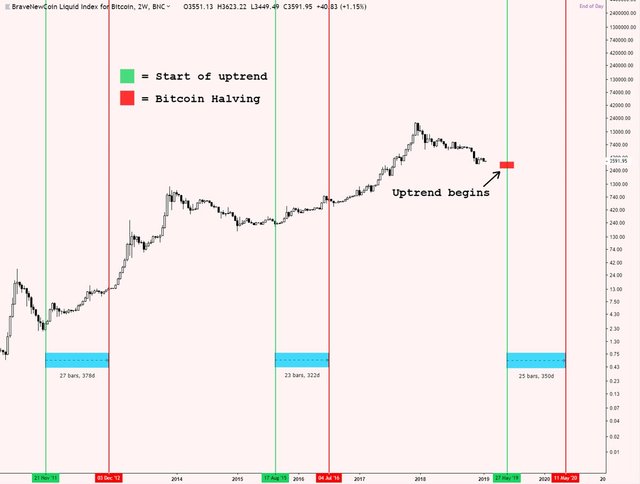
Analyst: Bitcoin Halving Anticipation Could Lead to BTC Price Surge:
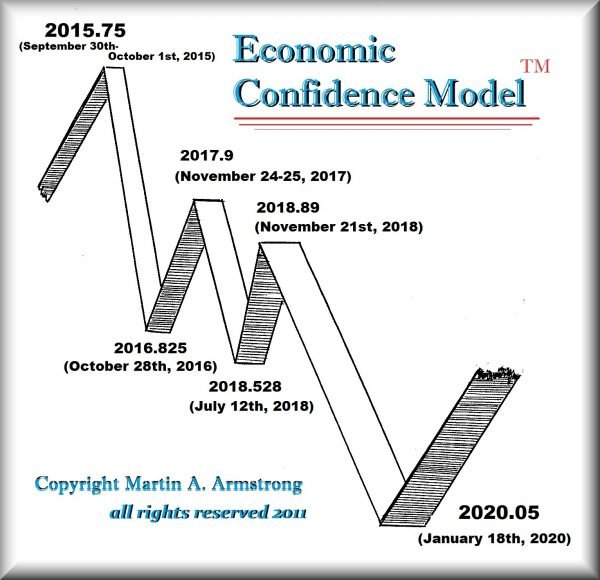
EDIT: also the Fed has pulled back on raising interest rates for the time being, which is causing a rally in all speculative assets such as the stock market and so far also Bitcoin is rising. The Fed is apparently (c.f. also and also) reacting to a global economic meltdown that has been (c.f. also and also) accelerating since latter half of November, presciently predicted many decades in advance by Armstrong’s ECM cycles model:
MarketWatch published:
“The bar to restarting rate hikes in the near-term seems to be quite high, with several participants arguing that rate increases would be necessary ‘only if inflation outcomes were higher than in [the] baseline outlook.’ The upshot is we now expect the Fed to leave rates unchanged throughout this year, before a further deterioration in economic growth forces it to cut rates by a total of 75 basis points in 2020,” said Paul Ashworth, chief U.S. economist at Capital Economics, in a note.
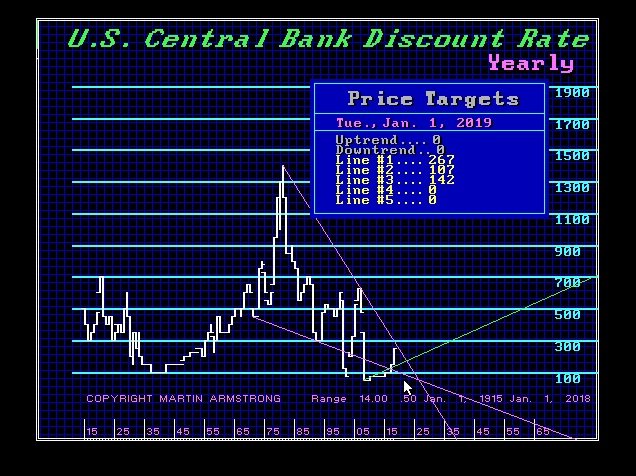
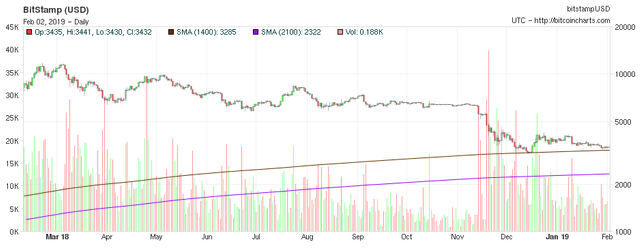
The Fed will at most effectively lower interest rates by ~1% going into the 2020 global economy low (with actual Fed rates cuts not likely until after European summer elections coinciding with the likely lift-off of Bitcoin due to one year before halving) with a breakout from the 4 decade downtrend in interest rates before the 2024 USA Presidential election as shown on the following chart where the current green uptrend line cross the upper trendline of the 4 decade declining wedge:
So this respite in interest rates increases over the next few years is going to allow speculative assets such as Bitcoin to rally into a new nosebleed, moonshot ATH above $50k by no later than Q3 2022 (and perhaps sooner). Also Asia’s decline will bottom in 2020 and they will start growing again. Whereas, the West will topple over the economic cliff into the abyss, especially after 2024. So the next Bitcoin ATH many years after 2022 will be driven by Asia, not the West other than demand from the West for storing assets outside the increasingly draconian Western financial system.
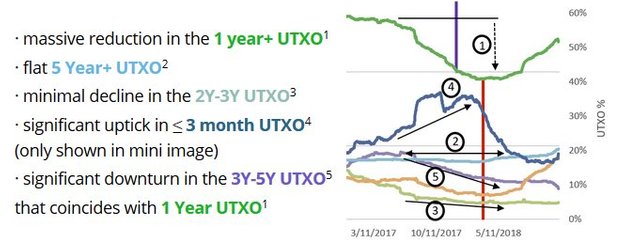
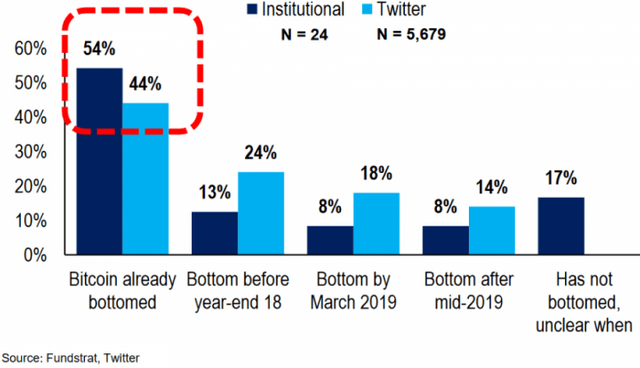
Also the accumulation that started at $6k last year has restarted, while the selling pressure is depleting and 75–85% polled think the bottom will have been achieved no later than Q1 of 2019:
As for the current state of the market, CEO of cryptocurrency company Circle, Jeremy Allaire, explained during a recent AMA (Ask Me Anything) session on Reddit: “My general perception is that the markets have been oversold and that some core assets have decoupled from their usage, which suggests they are undervalued. We look at things like hashrate health, on-chain activity, as key indicators of usage and adoption and underlying unit economic support.”
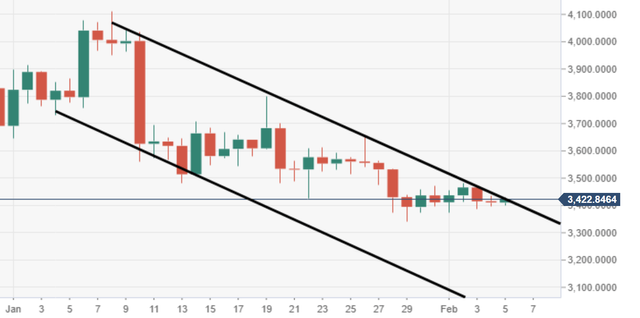
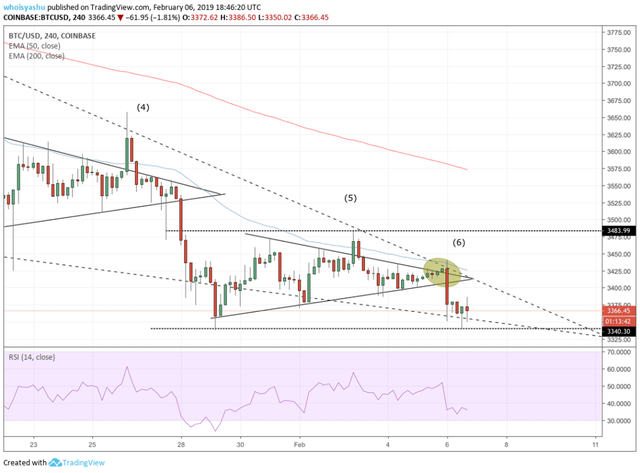
Also the news today that Fidelity Investments will launch their institutional BTC custody service by March, and the following charts shows the potential for a double-bar bullish reversal with key Fibonacci levels met:
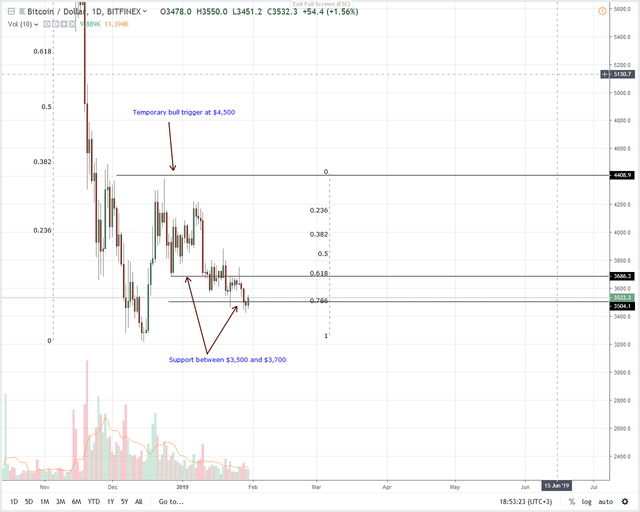
Over the next several weeks (perhaps to peak with a sell-the-news event when Fidelity launches in March), BTC is likely headed back up to the 0.5 or 0.618 Fibonacci retractment level, so between $4800 and $5400, before retesting the bottom again before the potential summer lift-off at a year before the halving.
Note the potentially bullish near-term ascending triangle may have failed, so we might decline slightly first for a few days.
EDIT#2: For the past 4 years, February has been a month of Bitcoin rallies. As I predicted in my prior edit above, the Bitcoin price dipped and now looks poised to make another run at breaking through overhead resistance.
The bearishness expressed in the following widespread gloom (an contrarian indicator that a bottom has been reached), is indicative that we need a bull-trap rally now:
How Bitcoin (BTC) Could Plunge To as Low as $1,700 In Coming Months, Crypto Analyst Says
As the hype around the next Bitcoin (BTC) block reward halving starts heating up, it appears a bull reversal is inevitable. At least that’s what a leading crypto analyst thinks. The bulls may actually be preparing to run, and the bears might still have their last hurrah, as they draw blood savagely before hibernation.
Murad Mahmudov, who is also a digital currency trader and hedge fund hopeful, gave a theory highlighting why the “famous 200-week MA support” for the Bitcoin (BTC) price will inevitably break in coming months.
Bringing in the cryptocurrency market’s historical cycles, out of which three have reoccured so far, Mahmudov cited that the important 25 MA, 50 MA, 100 MA, and 200 MA shifted “‘one level’ backwards with each cycle.” Each multi-year trade or market cycle, the significance of each MA position decreases, as the averages pertaining to the longer time frames fall into their positions.
Hence, a reason why Mahmudov remarked that as is the case with the 200-week MA was a level of the utmost importance for Bitcoin (BTC) from 2015 to 2018, then the 300 MA (and potentially 400 Ma as well) will be integral trendlines to watch out for in coming months.
Following this, the trader reached the conclusion that he expects Bitcoin’s (BTC) “steady support” will be discovered at a 300 MA of about $2,400. However, the crypto trader made it clear that BTC could drop to as low as the 350 to 400 MA to the $1,700 range. Citing “past price patterns and how overstretched the 2017 boom was.”
Remember I also stated in my prior edit that I thought it likely the Bitcoin price would rally in February, then decline anew to a final bottom before the summer and the beginning of the year before halving (where long-term bull markets have started in the past).
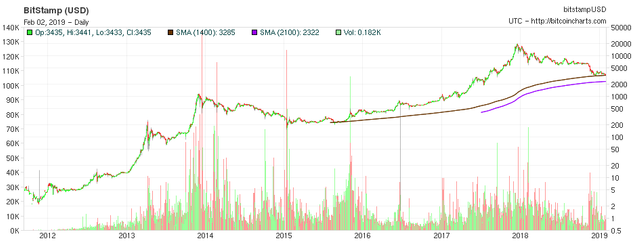
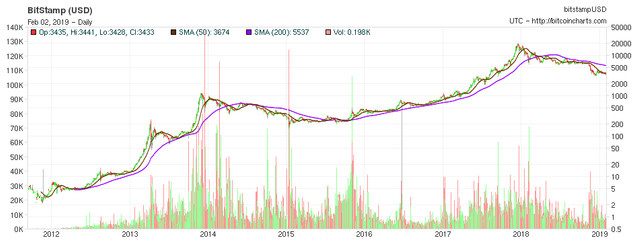
But I don’t agree that Bitcoin necessarily has to fall to the 300-week MA, but note that MA will be higher (perhaps ~$2800 by June) some months from now when/if Bitcoin declines anew after rallying. This is illustrated in the following charts, including a chart showing the bearish and bullish crossovers of the 50-day versus 100-day MAs.
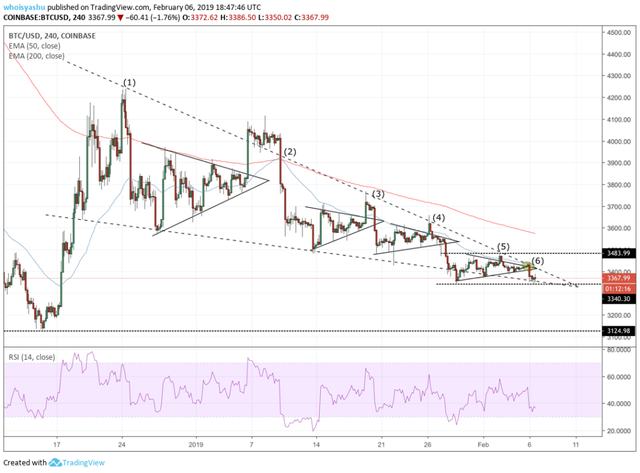
EDIT#3: Moment of decision has arrived:
EDIT#4: Price breakout to the upside of the downward channels and bullish wedges is very likely imminent tomorrow Feb. 8. Volume has also shrunk to the lowest in years, so any burst in volume can lead to a spike up.
Also Twitter founder implies real demand for BTC and away from what he thinks are fractional BTC reserves at Coinbase could lead to a rally (remember Fidelity Investments will launch their institutional BTC custody service by March):
Bitcoin Price Analysis: BTCs at CoinBase are Fake—Jack Dorsey
The 50 month at 3100~ is a good MA to test and potentially hold. Great analysis as always.
Also note how LTC halving "led" last bitcoin halving by roughly the same timeframe, and caused a mini-alt season and general crypto "breakout" and retest. It is expected in early Aug this year.
Cheers for the heads up on this edit :)
Yeah, I was reading about this. Seems encouraging. Hope it turns out that way.
Do you give any credence to this I saw yesterday on Zerohedge, that"not everyone is convinced [...] that The Fed is done," and that "The Fed's dot-plots are vastly out of line with what is priced into the market"?