RE: Most Important Bitcoin Chart Ever
S/F Model Provides a Plausible Reason for Coming Acceleration
I wrote in the prior post:
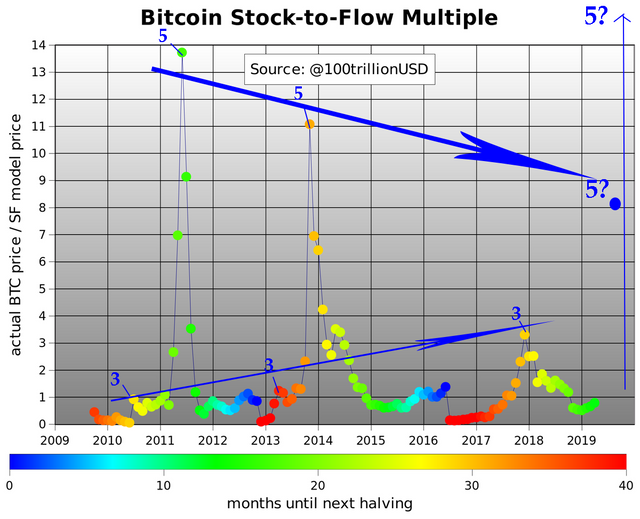
Tangentially, @infofront who originally on BCTalk had referred us to the chart that is the focus of this blog, today also correlated my observation above (i.e. the increasing height of #3 and decreasing heights of all other peaks including #5 aka #1) to a stocks-to-flows-ratio, pricing model for BTC peaks […]
@infofront wrote:
I made a post on BCTalk a while ago on why I thought it was strange that the stock-to-flow multiple for the previous bubble was so low.
The bubbles went from nearly 14x stock to flow, to 11X S/F, to 3x S/F. The downtrend in stock-to-flow bubble multiples was accelerating too quickly. My more recent thought were gravitating toward the next S/F multiplier “filling in the gap”, by being around 6-7X. (Stock to flow price post 2020 halving will be $55,000)
With your model in mind, and the “double bubble” pattern, with 3s being micro bubbles, followed by the real bubbles (5s), I have a new take on Plan B's graph:
The 3s and 5s correspond with the 3s and 5s on your chart. Mostly self explanatory, but 3s could be increasing at an increasing rate. 5s could be decreasing at a currently unknown rate.
Astute! I had forgotten about that S/F ratio. Indeed, but I wouldn’t think of it as “filling the gap”. My model posits that it’s an oscillating cycle that will repeat inexorably. This is apparently what John Mcafee means where he tweeted that Bitcoin is never in a bubble […]
As the #3 rises to become a #5 for the second of a large red-circled peak, then
I posit #5 may rise again to 14X and the subsequent #3 may decline to 1.
In the S/F model I can find more support for of my postulate. The regression fit charts (cited in my prior post) that others have been creating to fit to the history of the BTC price essentially only model the data in the following chart:
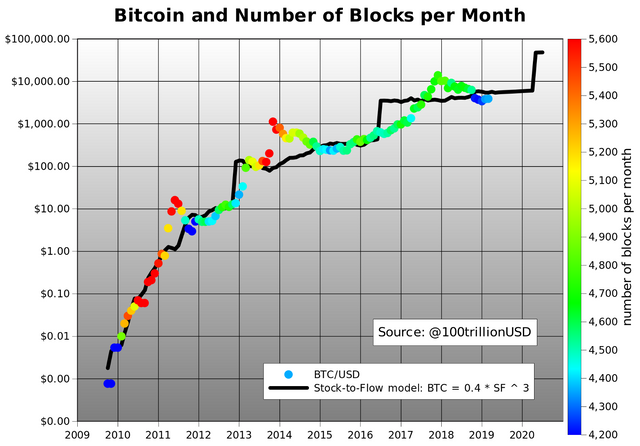
(click to zoom to the S/F model blog)
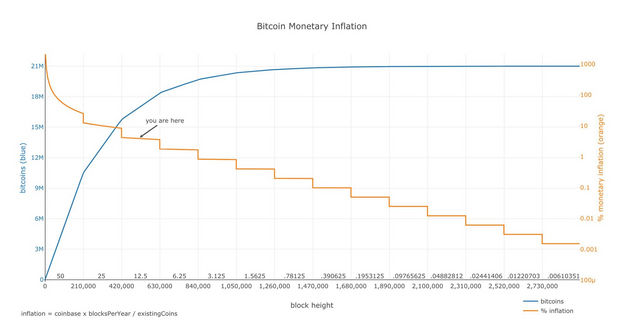
So essentially those regression fits chop off the entire lower portion of the staircase future on the following chart, because if we regression fit the orange line on the following chart only using data up to “you are here”, the projected orange curve would flatten from “you are here” going forward:
(click to zoom to the S/F model blog)
So we can explain the extreme overshoots of the price in 2011 and 2013 by hiding the future of the model and note the market presumed the trajectory would continue.
Conversely the regression fit charts and market sentiment decelerated too much because the BTC deceleration was extreme, but that deceleration is actually much less than projected without the knowledge of the S/F model.
So currently the market is presuming a trajectory which is much more decelerated than the actual future. Even we have many people thinking Bitcoin is a Tulip Bubble and failing to realize that from now on the S/F model predicts roughly a 10X increase in price every 4 years FOREVER!† Let the profoundness (and scariness) of that last sentence sink into your consciousness. There is no way that the market believes that trajectory at the current time.
So it’s plausible that as the halving occurs in May 2020, the market will be suddenly jolted into a trajectory projection which is too accelerated, thus taking the ratio to the model price back up to at least 8 x $55000 = $400,000 which was John Mcafee’s original prediction.
Imagine a differential equations model wherein the market is an inertial mass suspended on a spring from the actual model price.
The market has not yet been educated about the S/F model, so it doesn’t realize what the model price and trajectory will actually be, and thus the market will oscillate (probably for many more years) around too accelerated and decelerated with dampening factor such that eventually the oscillation dies out and the market will follow the S/F model with lower overshoots.
The S/F model has been added to TradingView.com.
† Further halvings terminate when the minted block reward is 1 Satoshi. There’s some uncertainty as to whether the stocks-to-flows model valuation will diverge as transaction fees become significant relative to the minted “coinbase” portion of the block subsidy.
Implication for Altcoins
Note the extreme deceleration of BTC is what likely drove the recent altcoins mania. So as BTC re-accelerates I posit that altcoins could decline to all-time-lows (ATL) relative to BTC as BTC’s percentage of the total cryptocosm market capitalization could rise significantly again.