You are viewing a single comment's thread from:
RE: The Coinigy Market Scanner will be a game changer
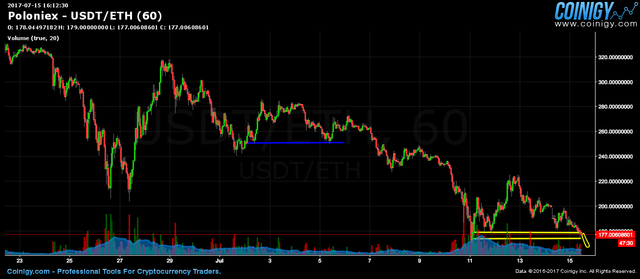
Hey Luc! You've been a real inspiration for trading by sharing your videos. Thank you very much! Today is my first day jumping into the deep end. This is the chart I have.
I drew two yellow bases trading base on them. The circle is where I plan to buy. Am I getting the idea of bases? If not, poke many holes in it.
My second question is the blue base. When looking through the chart, that's a base I found. However, the chart never recovered when it broke the base. Is this a bad base or a weak chart?
hey, thanks for including a chart.. Ok so lets talk about this.. so panics are when bases are broken and all the buyers/holders are shaken out of there postions, they are surprised and panic sell, droping the price.. right? ... ok, so then when the panic stops, people start buying it back up to previous support... ok.. so.. it can now trade around in that area, beacuse we have just redifined a suport and resistance level..
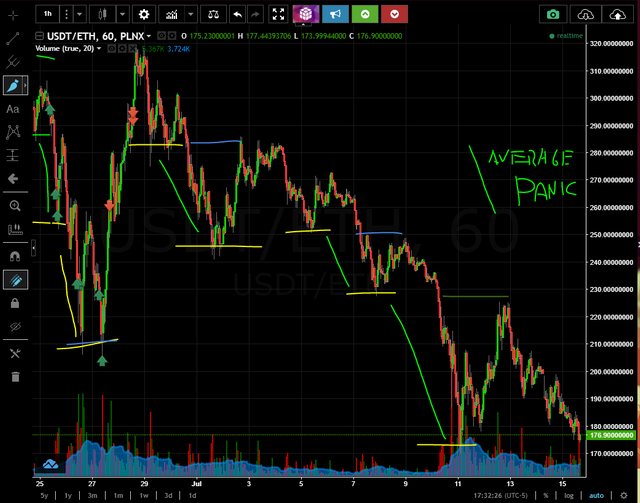
Man this is hard to explain without video.. ok let me redraw your chart..
The green lines are your panics.. notice the length of the lines.. so this guides you on where you should put your buy orders.. the blue lines are where prices returned to there bases after the panics..
Anyways, its the same chart only maybe this might help you to see it a little different with more colors.. Sorry its not easy to explain in text as easy as it is for me in video.. but basically you need a panic of near the average length to be safe.. so if you buy in that circle you drew, then you should just nibble and wait for a drop to get more
Thanks Luc! I noticed this weekend it dropped/panic below the 2nd yellow line of 170 to around 140. It recovered back to 170 for a short time. I'm catching on!
On another subject, it would be cool for you to analyze this chart in one of your videos. The volatility is crazy! It seems like every hour there is a new base. Plus, the volume seems pretty good.
yup, i have been trading it.. but I missed that last crack as you can see.. my order was a little too low.. but i did catch 2 trades on BAT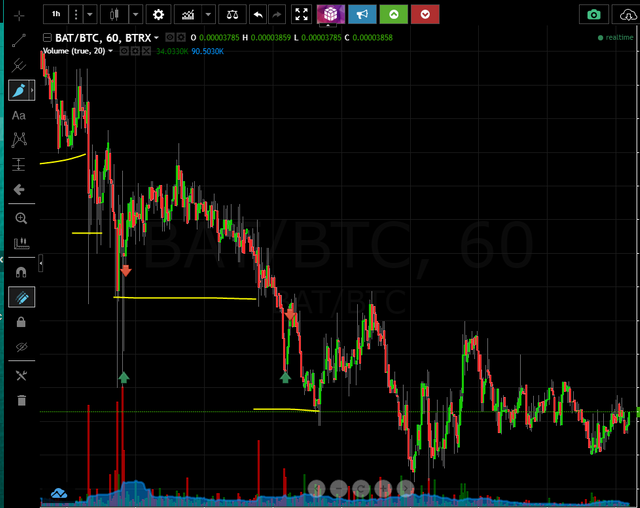
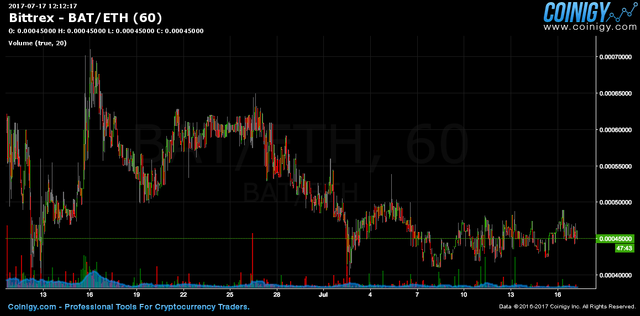
Your chart is BAT/BTC. I'm showing BAT/ETH. It seems to have much larger swings. Have you checked out BAT/ETH?
Btw, I enjoyed your recent video. Good job.
no i didnt list BAT/ETH in my favorites.. but ill check it out