GOLD : Daily Technical Analysis June 9, 2021

GOLD/XAUUSD has an interesting setup for our day trading. Where since a few days ago, this commodity appears to be in a pattern that is quite interesting.
Check out XAUUSD in the following Daily chart:
GoldGold
Judging from the chart above, it appears that the commodity price of XAUUSD / GOLD is still stuck around the upper limit of the Resistance Zone (Yellow Triangle) which describes the market's attitude towards the mild upward movement of the US dollar, so that new sentiment may be able to help this safe haven to clarify its trend signals.

The scheme of the Resistance Zone is, we are aware of the formation of a Lower High Daily in this Zone, so we will remain vigilant of a better selling resistance AS long as the price is still struggling in this Zone, where the Bullish Daily will be confirmed strong IF the price is able to build a strengthening momentum in it, even up to able to break it out. Lets see.

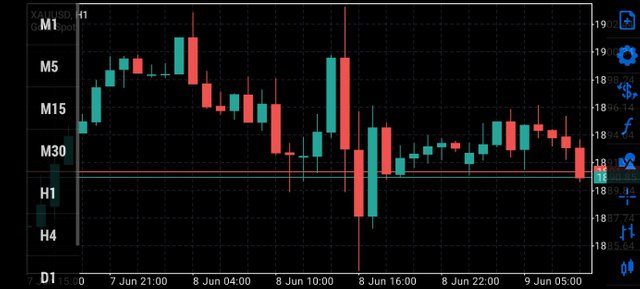
For today's entry review, let's look at XAUUSD in the following 1 hour chart:
GoldGold
Based on the picture above,
I have determined the following intraday Support and Resistance price levels:
Resistance2 (R2) : 1908,14
Resistance1(R1): 1899.90
Support1 (S1): 1884,48
Support2 (S2): 1876,12
In the chart above, it appears that GOLD was only lightly holding back, leaning to the South, after the price formed an almost equally strong two-way rejection, as a signal of market uncertainty.
Today, focus on the analysis of the price reaction to the surrounding charted levels to aid the confirmation process while keeping an eye on the latest sentiment around the US dollar and risk appetite. Stay objective!
The Volume Type indicator will help to read the magnitude of interest in the price for opportunities for direction formation.
The R1 level and the S1 level will also measure how much traders are interested in this XAUUSD commodity, a breakout at one of these levels will be an indication of a good price direction.
Beware of a consolidation pattern or false breakout between the R1 level and the S1 level today.
Don't assume (Just Trade What You See, Not What you Think).
Lets see.
Well, in my view/prediction, based on the price movements we analyzed above, today we will try to see opportunities for available entries. However, technicals do not allow assumptions to play, so the best entry that can be made is, we will continue to see the CLOSE PRICE movement on the 1 hour candle.
My setup for Breakout opportunity GOLD
Buy : If the price of the 1 Hour close candle penetrates the R1 level, then get ready to find the best BUY Entry position, you can also let your position reach the R2 level (the strongest Resistance level today) to see the market reaction to that level to go back up or not.
Sell : If the price of the 1 Hour close candle penetrates the S1 level, then prepare to find the best SELL Entry position, you can also let your position reach the S2 level (the strongest Support level today) to see the market reaction to that level to go back down or not.
My setup for Pullback opportunity GOLD
Sell : If the price of the 1 Hour close candle does not penetrate the R1 level (such as forming a bear pin bar), then prepare to find the best SELL Entry position, but if the price reaches and breaks this level, prepare to cut loss. Can be applied at level R2 as well.
Buy : If the price of the 1 Hour close candle does not penetrate the S1 level (such as forming a bull pin bar), then prepare to find the best BUY Entry position, but if the price reaches and breaks this level, then prepare to cut loss. Can be applied at S2 level as well.
Always use a Risk Reward of at least 1:1 or 1:2 and a trailing stop loss (manual or automatic) when necessary. You can use support and resistance levels for your analysis reference to determine Stop Loss and perform Cut Loss, stay alert for price consolidation.
Continue to use good money management in every entry for the continuation of healthy trading, hopefully this article can be your reference in analyzing the market.
That's all i can say my friends
Follow me
@fadly
start success go! go! go!