How To Trade Cryptocurrency with Bollinger Bands
Bollinger Bands
Today, I will be discussing on TA tools topic: Bollinger Bands.
What are Bollinger Bands (BB)?
It's an adaptive trading bands that reflect changes in volatility and provide a clearer picture of the true extent of price movement/action.
BB can be used on most financial time series, including equities, forex, the stock market and cryptocurrency trading.BB was discovered in 1980 by an American named John Bollinger.
So, in order not to bore you out with history and theories. I'm referring to Bollinger Bands if you see "BB" in any part of this article and Technical Analysis in the case of “TA”
BB answers questions in how high or low prices are on a relative basis. By technical definition prices are high on the upper band and low on the lower band.
The picture below display upper and lower band:
The chart above contains two flexible trend lines:
The red which is the upper BB
The yellow which is the lower BB
I know somebody wants to ask about the white in the middle, yes the white? It's called SMA ( Simple Moving Average). Now let's focus on the red and the yellow flexible trend lines, which are upper and lower bands respectively and they are what determines how we use BB for trading TA tools.
There are basically 5 types of BB:
Constriction BB
Bullish Expansion BB
Bearish Expansion BB
Bullish Move Up BB
Bearish Move Down BB
I will discuss each one of these BB in details and how they influence trade/stock market/forex and cryptocurrency price action based on volatility.
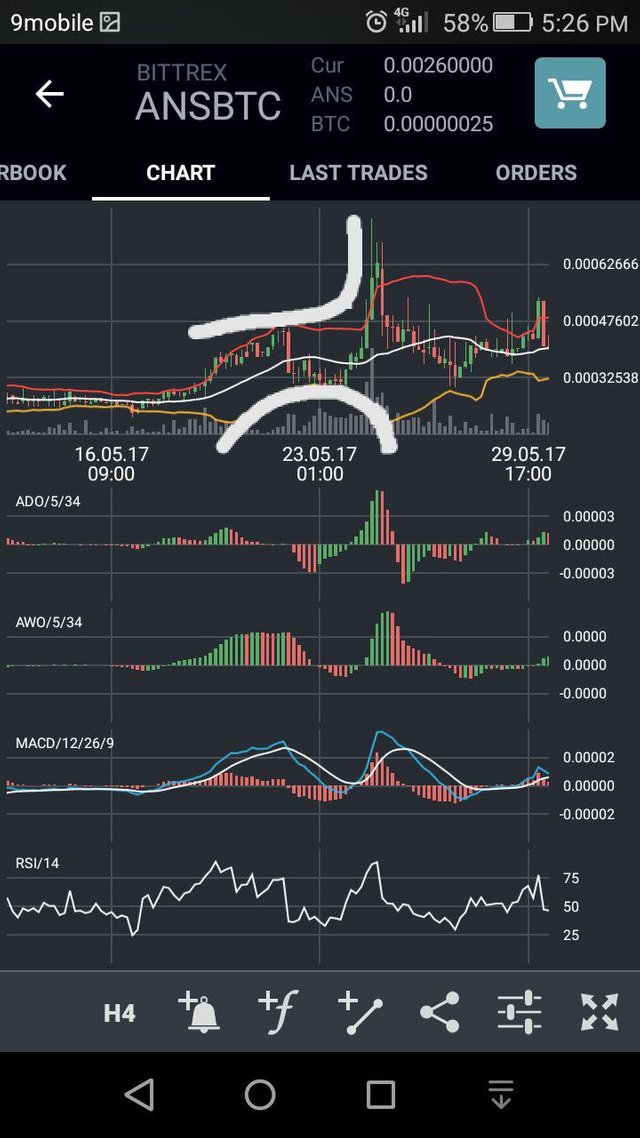
Constriction BB: As the name implies the literally i.e. action of making something narrower by pressure or of becoming narrower; tightening. This basically depicts volatility decrease of a particular trade or market or price action during a set period of time. The picture below shows examples of Constriction BB:
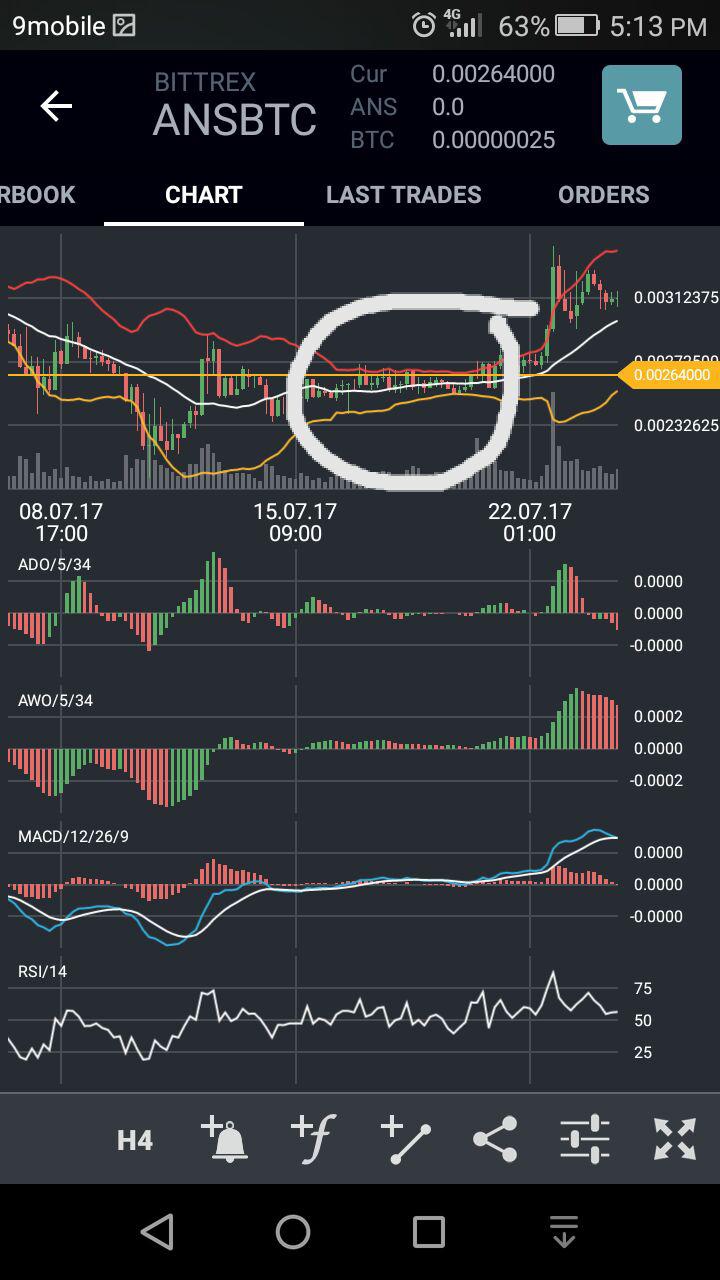
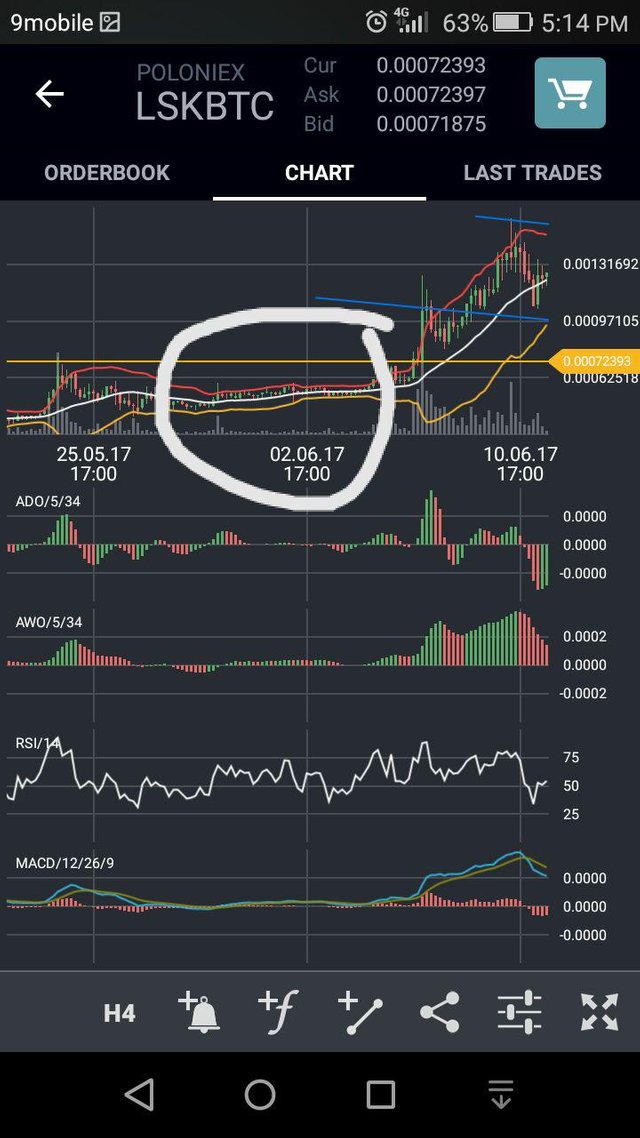
Take note of the white circled area in the chart above, at that point or time frame the volatility of the market of those two BTC/Altcoins trade are tight in other words, the markets lack attention and due to this, there was a low volatility. And Volatility is what brings money in trading.
I guess the question will be, how do I apply this to my TA decision? Simple,the application is quite easily done in such a way that the market is not a good one at that point in time because no much volume of trading is taking place,so for me I won't enter this market based on my BB TA, note other TA tools might project me into the market but since we are focusing on BB now. Is a no way entry for me.
Hope you remembered the definition of BB? Ok! Let me help you out concisely.
BB is all about volatility and price action of a market in either upper or lower way depending on the trend of the BB.
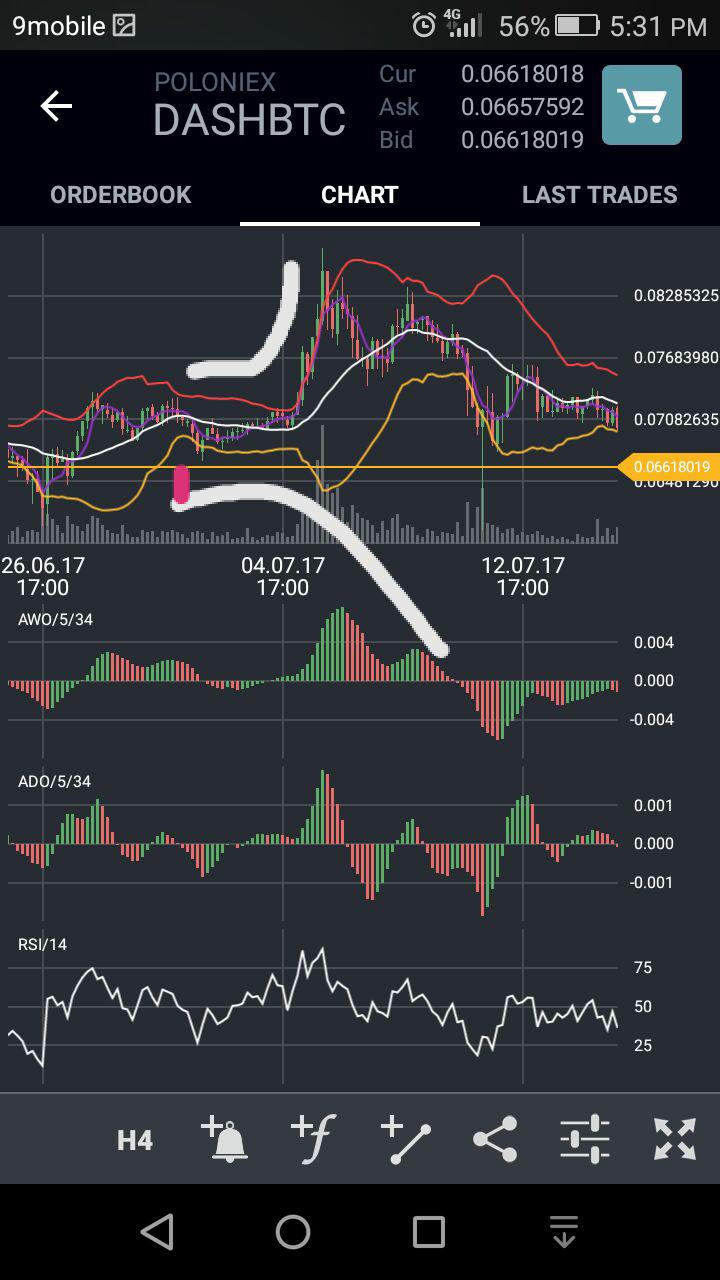
The second type of BB is called Bullish Expansion: At this point, price will walk up or stick up to the upper BB ( the red line). And note this the Upper BB will expand upward (North) and the lower BB will expand downward (South). See the chart below for better clarification:
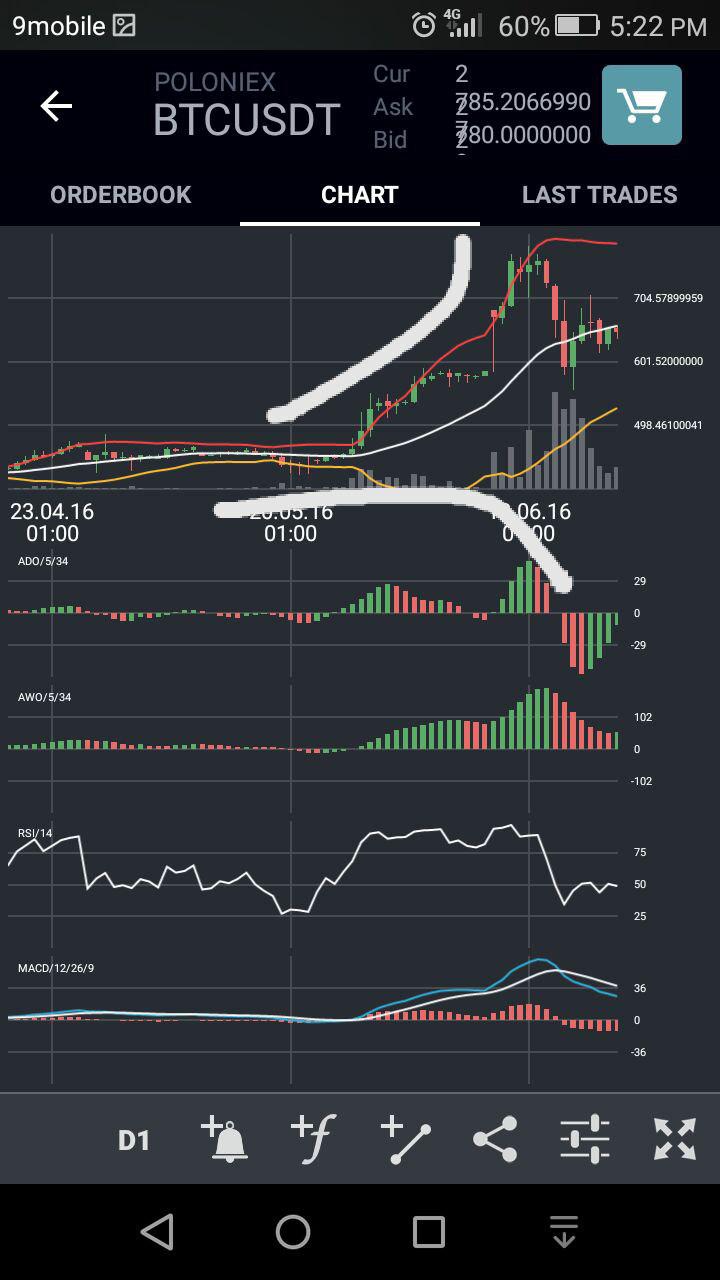
This how bullish expansion looks like.
Note the white line I drew, is like an open mouth with the upper BB(red) facing north and the lower BB(yellow) facing south. Now if you look through the chart you will see that there was a bullish price action movement.
Note: Before determining a bullish expansion BB, a candlestick or two are meant to touch the upper BB( RED). If possible protrude out the upper band. Then comes the bullish price action.
Take note of this very well, I repeat take note; before a bullish expansion the candlesticks in the BB must have tilted towards or touch the lower BB( YELLOW) earlier. Will show how it looks like in the chart below.
If you look through this chart you will see a pink line I drew. At that point, the candlestick touched and protruded out of the lower BB( YELLOW). Thereafter comes the bullish expansion price action.
Another example below:
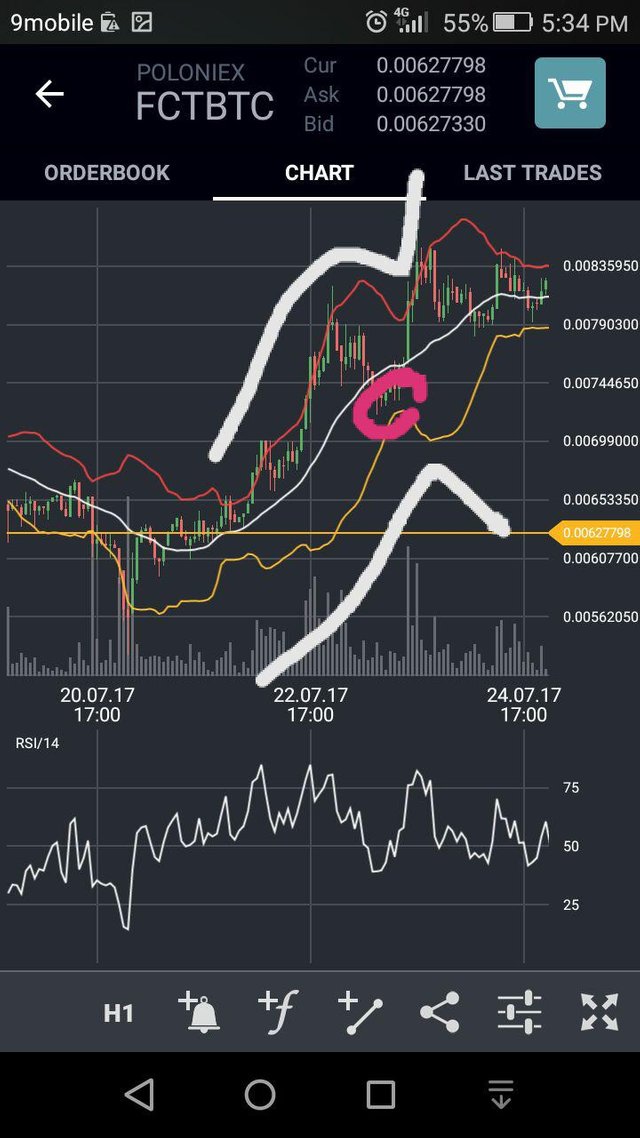
A perfect Bullish expansion there for you. But take note of the circled area, It almost touched the yellow line which is the lower BB. In summary, the Bullish expansion speaks about high volatility and trading volume.
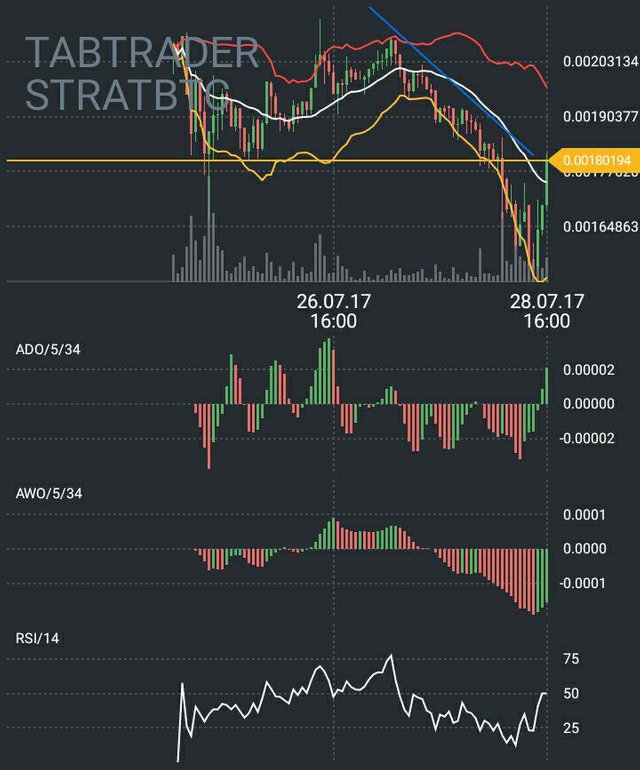
The third type of BB is Bearish Expansion which is the opposite of Bullish expansion. Everything that happens on bullish expansion thinks of the opposite in the bearish expansion. See the picture below:
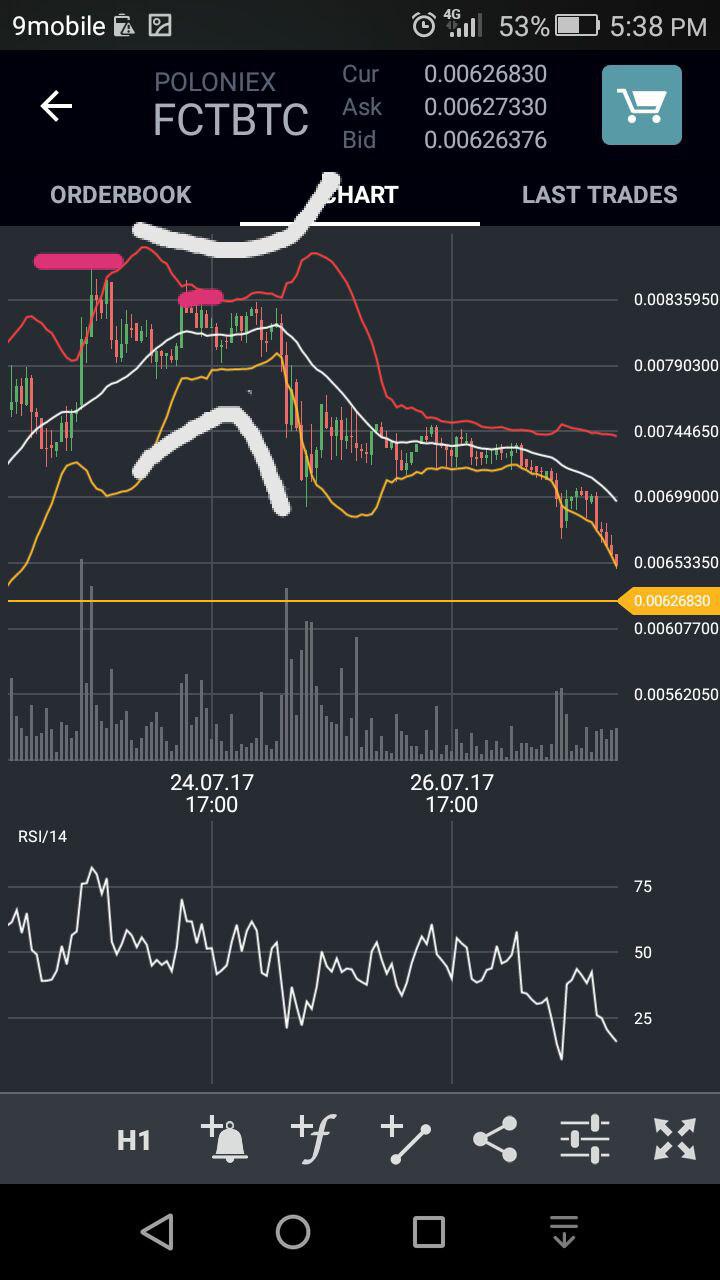
This is a bearish expansion BB and the pink horizontal line touched the upper band (red) twice and the third one almost touched the upper again. Then comes the price drop or better still the bearish price action.
So simple, as long as you understand bullish expansion, you understand the bearish expansion.
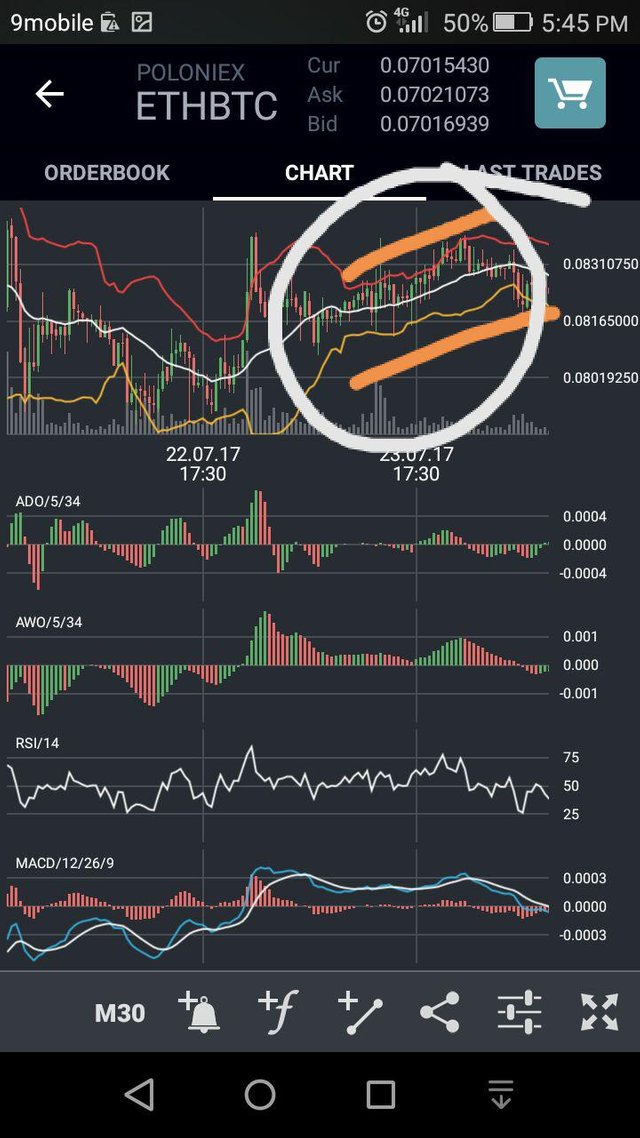
The number four type of BB is Bullish Move up: A bullish move up is when upper BB (red) heads up or north and the lower bands(yellow) heads up or north as well. So in a nutshell, what this depicts about volatility is that the price action will not be extreme and lengthy as bearish expansion. And the volatility is not at is peak as bullish expansion.
The picture below shows an example of bullish move up:
The last but not the least type of BB.
Number five type of BB is called Bearish move down which is the direct opposite of Bullish move up. For everything that happens for a bullish move up reverse is the case for a bearish move down.
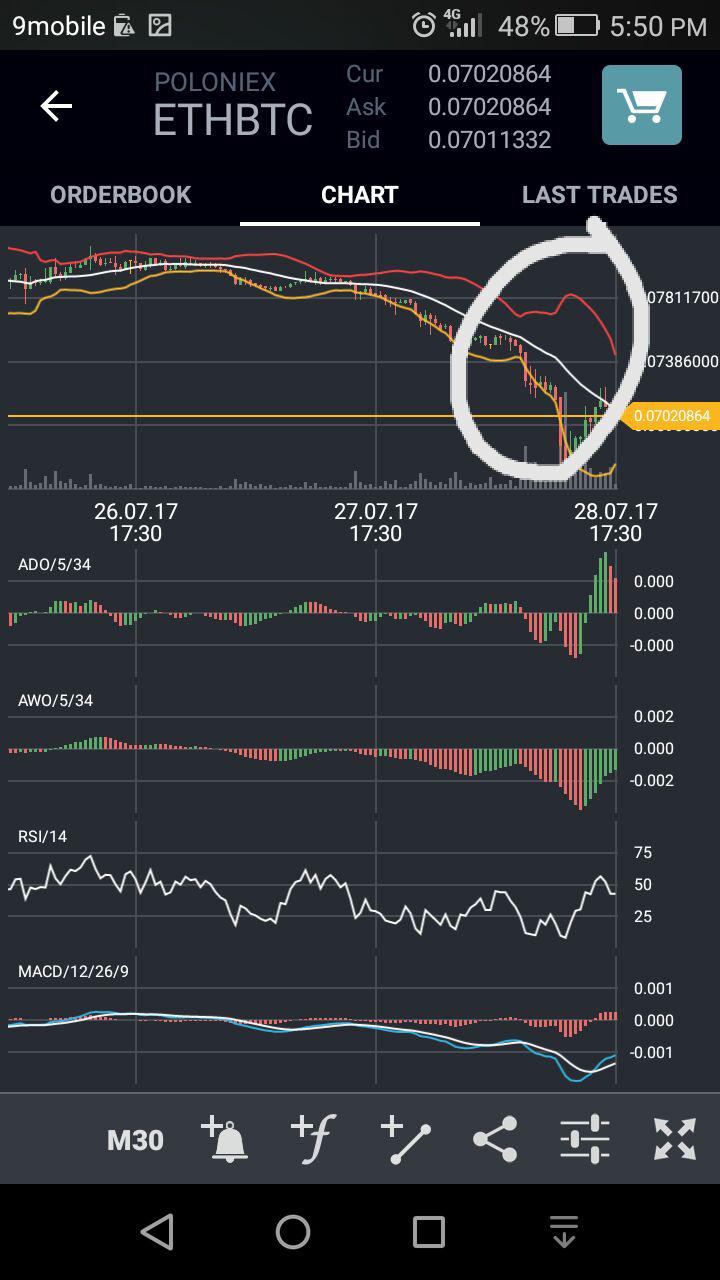
Take note of the direction of the red and yellow BB, where they are heading to down or south.
The following rules guide BB use for TA:
BB provides the relative definition of low and high price. By definition, price are high at upper BB and low at lower BB
Relative definition can be used to compare price action and indication action to arrive at rigorous buy and sell
BB can be used in pattern recognition to define or clarify pure price patterns such as Double top or Double bottom, Head and Shoulder and Inverted Head and Shoulder Pattern
Tags of the bands are just tags and not a signal
BB can be used on bars of any length/time frame 5mins,1hour, daily or weekly chart.
To the best of my knowledge, I think have been able to justify the use of Bollinger Bands as a TA trading tool. Thank you!
i-am-mr-sam
Nice one, Mr $am.
Expecting more to learn from you.
Thanks
My pleasure
Congratulations @i-am-mr-sam! You have completed some achievement on Steemit and have been rewarded with new badge(s) :
Click on any badge to view your own Board of Honor on SteemitBoard.
For more information about SteemitBoard, click here
If you no longer want to receive notifications, reply to this comment with the word
STOPGood job brother
Gracias por la info👍🏽🇨🇴
Bit old but still useful thanks https://9blz.com/bollinger-bands-indicator-explained/
Great information Thanks for sharing with us.
Here also similar recent updates on information : Bollinger Bands