Big Experiment. Tic-Tac-Toe (Point and Figure) chart (part 4)
The next unusual chart in my experiment is Tic-Tac-Toe chart. It is also called Point and Figure chart (P&F).
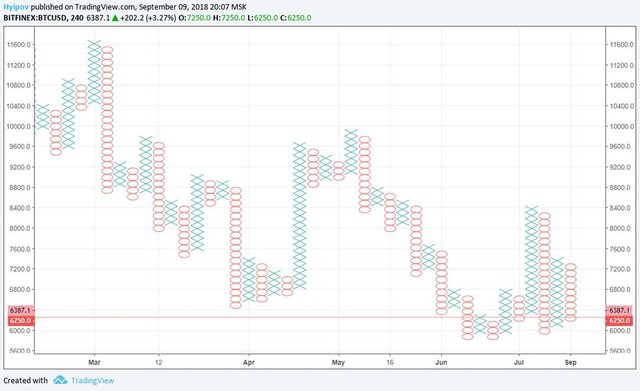
It is a price chart that is not directly linked to the Japanese culture. It was first mentioned in 1881. I’ve managed to learn that the P&F approach originally comes from the USA and was first introduced by Joseph Klein and Charles Dow. Due to its geographical origin, the Tic-Tac-Toe chart is still a popular technical analysis tool in the USA.
On a point and figure chart, there is no time axis, only a price axis. The chart is constructed, based on the principle, similar to Renko. You also set the size of the price unit (block) that looks like X in the bullish market and like O, in the bearish market.
Read the article completely on my site >>>