⚡Order Block Indicator ⚡ Best Price Action Indicator ⚡
Why You Should Trade with Order Block Indicator?
The Most Successful Traders Use This
➡️ Identify HIGH Probability Order Block Zones
➡️ Subjective Analysis Based on Higher Timeframe
➡️ Pinpoint entries, High-risk reward & Low drawdown trade setups!
➡️ Timely Alert System for potential Trade Opportunity
We know how important it is for retail traders to get their hands on accurate market information, and we’ve been working hard to make sure you can do just that.
But there’s a problem: how do you find the footprints of market makers? How are you supposed to get an exact pin-point entry price?
We’ve got the answer: our new order block indicator, which gives you the exact location of market makers on chart so that you don’t have to search blindly in the dark. With this new indicator, finding footprints has never been easier!
Let’s first talk about the other conventional and fancy indicators like a web of moving average lines. These indicators look very interesting at first look. But a simple buy and sell arrow will not make you a profitable trader. Trading the Trillion dollar market is not so simple.
Here's why conventional indicators fail to accurately reflect the real market
❌ Repainting indicators can make you think you are profitable, but these indicators lag behind the real-time price action and generate false signals
❌ The market can be unpredictable. If you’re a busy person, your trading psychology and emotions will overcome your trading abilities without you realizing it. You need a semi-manual trading system to overcome the psychological issues
❌ Mathematical indicators only plot the historical data without considering market conditions and can’t forecast the market accurately
❌ Technical indicators won’t reveal the footprints of market makers. Leaving you at the mercy of institutions, you need an accurate price action indicator
Most traders believe that fancy indicators are the best way to make profits trading. But in fact, these indicators actually do more harm than good by creating false signals and encouraging new traders to buy or sell
The shady secret behind the simple buy and sell indicators on the internet
Let me reveal the secret of these false indicators
Look at this moving average crossover indicator. A crossover happens after a complete price trend reversal, then after the reversal price shows a bullish crossover between two moving averages. Now, most indicator seller’s on the internet shift the signal from left to right by 4 to 5 candlesticks by programming. So, when a new trader looks at the chart, the buy or sell signal will be exact on the point. But in the real market, this signal will form after the complete trend reversal leaving you hanging in the losing trades.
Buy Now :-https://bit.ly/3MnXIrm
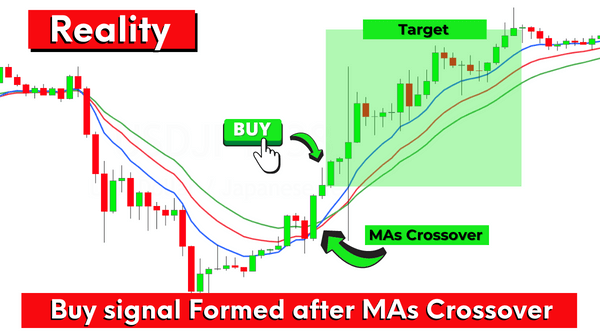
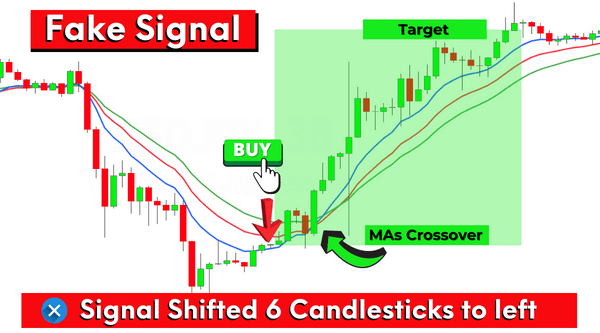
It means these are repaint indicators that cannot be used for profitable trading. These indicators look promising, but they have no worth in real markets.
Actually, all the mathematical indicators are lagging. It means they lag behind the price. They show the past behavior of price only. And fail to give any information that can be used to forecast the market accurately.
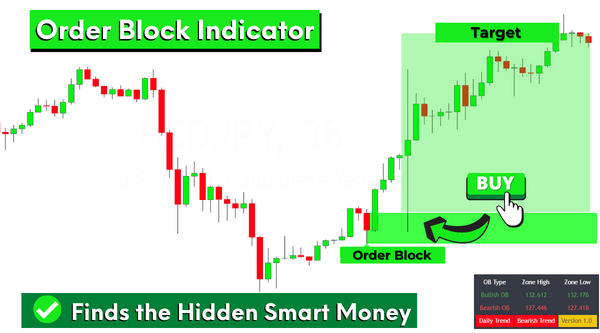
A trader needs a true price action indicator that can reveal the Footprints of big institutions and banks. And We have solved this problem by making the most advanced Order Block indicator. Our team has worked tirelessly to make this price action-based indicator and profitable strategy. and still working to improve it with time.
Buy Now :-https://bit.ly/3MnXIrm
Core Concepts of Order Block in Technical Analysis
Order block means accumulation/distribution of market orders at a specific price range.
Banks and big Institutions deal with Godzilla-sized amounts of money and they cannot execute their orders at once due to liquidity issues. Also, this decreases their profit potential. That’s why they always distribute a big single order into chunks of small orders at different price levels in a range to increase the profits. This also makes sure that their order will get executed without disturbing the market
These chunks of orders of big banks and institutional traders within a ranging market structure are called order blocks.
While trading we have to keep this fact in mind that 86% volume of the market is controlled by banks and institutions. So having an idea about their trading footprint will give us a huge competitive edge over other retail traders.
Two types of Order Blocks
There are two types of order blocks in technical analysis.
Bullish Order Block
Bearish Order Block
This is how order blocks help retail traders find the best prices to buy or sell with big institutions. In short, this is the way to become a consistently profitable trader.
Bullish Order Block
Buy Now :-https://bit.ly/3MnXIrm
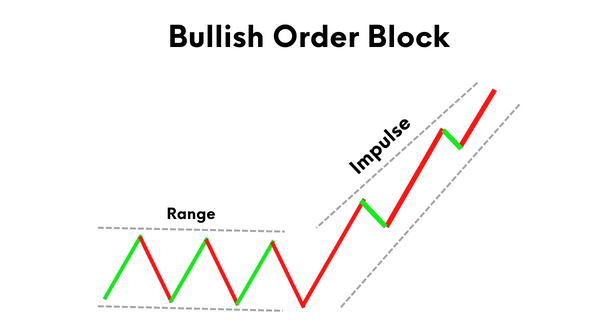
If a bullish order block forms on the price chart, then we’ll place buy orders. A Bullish trend will form due to large buy orders of banks and institutional traders, then we’ll follow them and will ride the trend.
Bearish Order Block
Buy Now :-https://bit.ly/3MnXIrm

If a bearish order block forms on the price chart, then we’ll place sell orders at that price range. A bearish trend will start from this order block due to large sell orders of institutions. This will let us ride the bearish trend.
This is how order blocks help retail traders find the best prices to buy or sell with big institutions. In short, this is the way to become a consistently profitable trader.
Purpose
Our main focus in trading is to identify those order block zone on the price charts using technical analysis. If we find these order blocks then we can predict the next move of market makers This will help us take more educated and high probable trades for generating consistent profits.
It is a famous fact that Trend is your friend and you can only make a profit in the market by following the market makers. And most of retail traders fail to do this because of lagging indicators available in the market.
Buy Now :-https://bit.ly/3MnXIrm


Working
In technical analysis, our focus as price action traders is always to find the repetitive market patterns. These repetitive patterns help us find the sweet trading spots on the price chart. Order block indicator works in a similar manner.
Buy Now :-https://bit.ly/3MnXIrm

Let me explain a bit in detail…
As we know, the order block zone shows the price range/area where there are chunks of market orders of central banks and big institutions. So, when these orders get filled then price always repeats a specific pattern on the price chart before and after filling the orders. This indicates to us that because of the huge influx of orders a new bullish/bearish trend has started.
The order block zone forms when after a sideways price movement, a big trend reversal happens, and the price gives big impulsive moves like in the image below.
There are two important parameters that shows the signs of order block formation.