Adding monitoring and dashboards to my servers
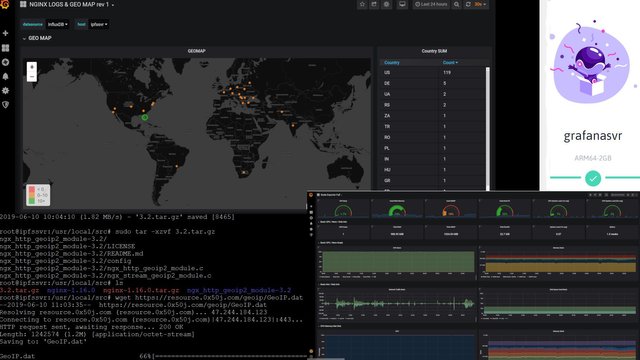
The last three or four days have been spent working full time in the terminal. Working with my LBRY Spee.ch Server that hosts all of my photography on the blockchain you see on my blogs. My lbrynet application was pretty outdated and I was experiencing memory leaks from the application causing it to crash over time. Due to this I updated the application but then my Spee.ch instance was throwing errors when uploading new photos. Heh.. luckily I write many of my posts ahead of time with my images already uploaded, this saved me from rushing to fix the issue so I could get back to posting using my servers. I went on LBRY's discord and got help from the team right away on my Spee.ch error, they suggested I npm run dev to compile before run start. So I consulted the github for Spee.ch and found out what I needed to do. Using the guides install instructions I was able to figure out exactly what was needed.
After reinstalling the application with npm I restarted the process using pm2 and I was up and running again, yay. Next up is the remove Caddy and install NGINX so I can monitor my traffic. After I get it working fully on my IPFS server ill give it a try on my LBRY server.
IPFS Server for video hosting
Go-IPFS released a new version 0.4.21 which was suggested to update as soon as possible to patch some certain concerns. I followed the instructions and quickly ran into issues with app. I realized my Golang app was pretty outdated so I got it to the new version and tried to run the app again. Working with people on the #onelovedtube discord I was able to correct some permissions issues on my files and migrated my 15 Gigabytes of videos pinned to my servers repo moved to the new IPFS instance. Still throwing some weird Go errors and working with the helpful folk over on that Discord.
Horizen Nodes:
I have a few nodes that process transactions on the Horizen blockchain. These nodes must solve challenge requests every so often to prove they are capable of having accepted transaction confirmations on the blockchain. Luckily for me, the Horizen Team already has some monitoring software provided to node operators.
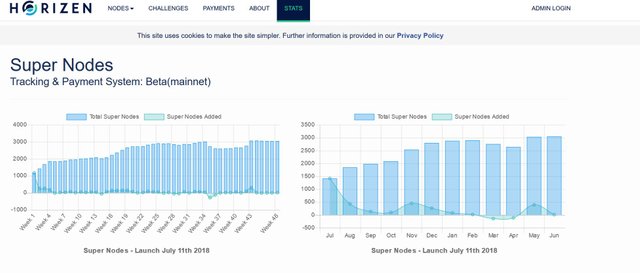
These stats are great to see how the node network is doing, and getting email alerts allows me to fix the issue right away. I can view payments made to my wallet, my virtual private servers specs and any events that have occurred. Now out of all the Blockchain nodes Ive run, this is the only Blockchain that offers this utility by default that I know of. I really like Horizen, formally ZenCash. The ZK-Snarks protocol seems like a good idea and having a node on the network makes me feel like im contributing to the protocol.
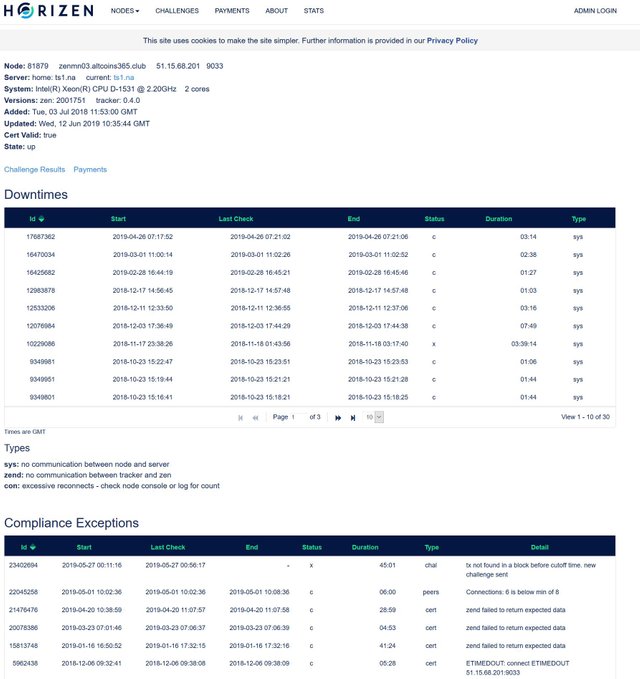
Wanting these kind of features and more on my other servers made me look into monitoring solutions for my Ubuntu servers I run. Many web based monitoring apps will run a local web browser and show them when you goto your IP plus a port number. I did not like the idea that anyone that knew this port number could see my servers running telemetry.
Though I found a monitoring tool called Prometheus, that collects CPU, RAM, Disk, Network and other stats from nodes that send it that data. I have it only run on localhost and it only serves time series data, not capable of an actual dashboard for visualizing telemetry. So by its self its not all that useful, though its data it collects is what I want to better manage my servers. I went online and found videos of people using a second app called Grafana to build dashboards with this data, and used a user account based login system for their metrics. Finally I found what I was looking for: system monitoring, but with a private dashboard.
Heres one of the guides I used to set up Prometheus and Grafana:
https://www.scaleway.com/en/docs/configure-prometheus-monitoring-with-grafana/
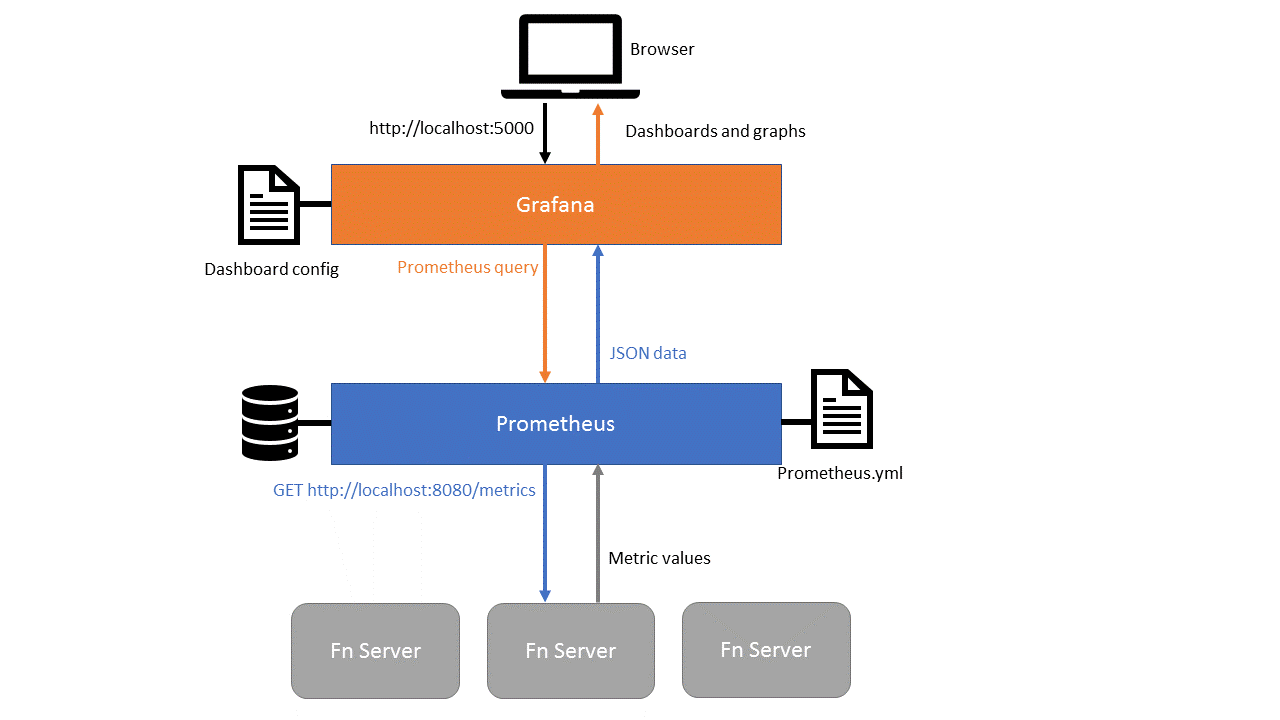
Grafana takes Prometheus time series database to build gauges, graphs display other important system information. And installation went smoothly, I first built it out on a local virtual machine to make sure its what I expected it to be. And then once ready I bought a ARM64-2GB Virtual Private Server from Scaleway. This was my first ARM VPS ive used, and I checked for packages for all the applications I used my test VM to make sure they were written for ARM64 as well. And I was in luck, they were. So saving a little money I got a very basic ARM64 4 CPU 2GB of RAM and 50 GB of SSD storage. It costs me about $3.50 a month.
Grafana Node
I got the ARM64 VPS up and running and did the same steps as on my x86 local VM but changed packages to download to ARM64.. All went smoothly with Prometheus, Node_Exporter and Grafana. I installed a dashboard and started pulling stats from all the servers I installed Node Exporter on.
Then I saw the GeoIP dashboard, it shows the locations of IP addresses that talk to my server. This can provide me some interesting data showing the regions that are talking to my server. So I started following a guide on how to set that up, and had to do alot of new stuff ive never done before on my servers. I learned how to load modules into NGINX, and installing plugins for it to use to resolve IP addresses to Counties. Setting that up for my access.log to show Countries listed next to the IPs took me a day or so to figure out.
Working on my IPFS server I had NGINX sorted out compiled with new modules I moved onto installing another app called Telegraf which takes the NGINX data and sends it to a Database on my ARM64 server, which Grafana queries to build maps of IP locations and show other important events.

Solominer above trying to use
apt-get purgeto remove a bunch of Python installs.
All went well with that until Python got involved. First I installed a bunch of versions trying to figure out how to run the .py script, then had to purge all of those. Did a search on Google for "Remove Python" and Luckily I got the results I needed.. hah was expecting something else.
I spent a day trying to get Python to work with Telegraf but seems it does not like an entry called {} in the .py file and I have no idea what to put in there or change it to make it happy. I am very limited in my coding so I stopped trying to figure it out. Python stops at line 25, and I have no idea why.
https://github.com/ratibor78/srvstatus/blob/master/service.py
So with that issue I had to stop with Telegraf. And I found another World Map plugin with Grafana that bypassed the use of Telegraf and that weird service.py script that would not run. Actually both made by the same dev, I used geostat.
I followed the steps and went pretty smooth, it had a .py script too but ran without much issue. I got the dashboard installed along with World Map on Grafana and started seeing map points light up, cool! Seems I get along of traffic from Florida, over 100 entries overnight. Though the NGINX log entries are not being passed through to the bottom part of the dashboard. Need to see if I can figure that out.
So next up is the following.
Get NGINX Log pass through to Grafana dashboard, not just IP map plots.
Get Go-IPFS 0.4.21 working so I can go back to uploading using my server and making my IPFS gateway working again. Current error stopping the daemon is
ipfs dae | 05:32:03.646 ERROR core: failure on stop: context canceled builder.go:47Install NGINX with GeoIP and Stub Modules on LBRY server so get metrics for my image posts.
Add timers to restart
systemctlservices that are prone to memory leak.PM2may not work for that. Will set timers based on what my logs show the lowest traffic times are for my nodes. Like not right after I do a blog post, as they are usually viewed alot for the first few hours.
| Coin | Donation Address |
|---|---|
 BTC: BTC: | bc1qhfmvd2gywg4fvrgy2kkkkyqta0g86whkt7j8r7 |
 LTC: LTC: | ltc1qdyzm5cwgt8e2373prx67yye6y9ewk0l8jf3ys9 |
 DASH: DASH: | XkSqR5DxQL3wy4kNbjqDbgbMYNih3a7ZcM |
 ETH: ETH: | 0x045f409dAe14338669730078201888636B047DC3 |
 DOGE: DOGE: | DSoekC21AKSZHAcV9vqR8yYefrh8XcX92Z |
 ZEN: ZEN: | znW9mh62WDSCeBXxnVLCETMx59Ho446HJgq |
Rockin Steemians
#rockhound & @rockhounds by @bitfiend
#shadowphoto by @melinda010100
#GTWCA (Crypto Price Analysis) by @gandalfthewhite
| Platform | URL/Username |
|---|---|
 Steem Steem | https://steempeak.com/@solominer |
 D.Tube D.Tube | |
 Weku Weku | https://main.weku.io/@solominer |
 Bit.Tube Bit.Tube | https://bit.tube/solominer |
 Mithril Mithril | Solominer |
 Discord Discord | Solominer#4248 |
 Bitcointalk Bitcointalk | https://bitcointalk.org/index.php?action=profile;u=83228 |
| https://cryptopanic.com/solominer | |
 Whaleshares Whaleshares | https://whaleshares.io/@solominer |
 Bearshares Bearshares | https://bearshares.com/@solominer |
#lbry #zen #ipfs #altcoins #blockchain #server #grafana #prometheus
there is a lot of updates on your server here, sometimes you get errors and don't know what to do and hate yourself lol
@cityofstars yeah linux has a steep learning curve that's for sure.. I'm slowly figuring out the issues though.
Posted using Partiko Android
You are probably aware of this, but sometimes is worth to note the most basic questions. Have you tried with Python 2.x and see if the error disappears. Python 2.x and 3.x are not compatible and that may cause your trouble.
@joelpugapt oh good point! I'll give running that a try, thanks for the tip.. maybe it is a python3 script as python 2.7 is running it now
Posted using Partiko Android
How I can learn like this in Thai?
Posted using Partiko Android
@tipwaree Best to use google translater.. When building these enviroments Ive had to figure out japanese blog posts and russian youtube videos.. luckily the code is all in english for me.. best of luck!
Posted using Partiko Android
Are all your servers hosted?
Posted using Partiko Android
@mytechtrail yup, on scaleway, synergy servers and nodesvps.
Posted using Partiko Android
Hi, @solominer!
You just got a 2.4% upvote from SteemPlus!
To get higher upvotes, earn more SteemPlus Points (SPP). On your Steemit wallet, check your SPP balance and click on "How to earn SPP?" to find out all the ways to earn.
If you're not using SteemPlus yet, please check our last posts in here to see the many ways in which SteemPlus can improve your Steem experience on Steemit and Busy.
Hi @solominer!
Your post was upvoted by @steem-ua, new Steem dApp, using UserAuthority for algorithmic post curation!
Your UA account score is currently 3.475 which ranks you at #6318 across all Steem accounts.
Your rank has improved 9 places in the last three days (old rank 6327).
In our last Algorithmic Curation Round, consisting of 173 contributions, your post is ranked at #57.
Evaluation of your UA score:
Feel free to join our @steem-ua Discord server