PONGF (Atari SA)
Technical Analysis:
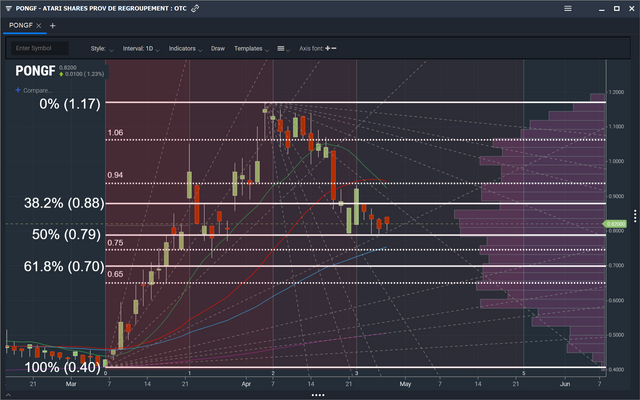
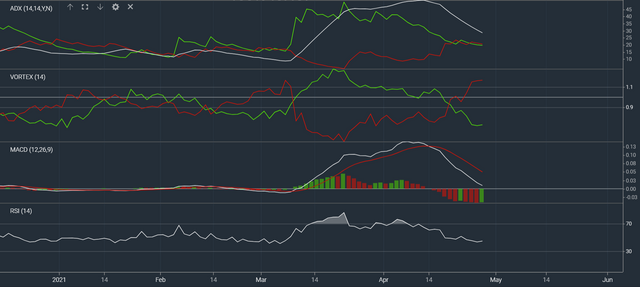
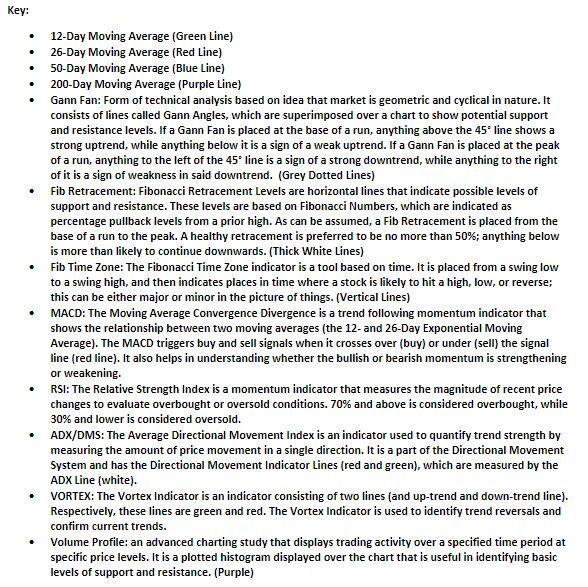
The stock I would like to analyze today is one in which I feel has good prospects for its future: PONGF (Atari SA). It is an OTC stock, so technical analysis of the stock itself probably isn't the best thing to do, but I'd like to give it a go nonetheless. As you may be able to see, I have drawn out many lines (levels of support and resistance) and technical indicators. For the technical indicators, I have posted a screenshot of definitions for said indicators in order to save myself the time of explaining them (I received these definitions from https://www.investopedia.com/). From these indicators, I have come to possible trajectories for the future of PONGF. From the beginning of March 2021 (when PONGF first came to my attention) until the peak at the beginning of April 2021, PONGF increased over 100% from a value of 0.50 per share. From the peak at 1.17 per share, PONGF has pulled back to what seems to be a healthy pullback at a price of 0.82 (I'm going off of screenshots I took yesterday 4/29/2021; PONGF went down to 0.75 as of today). A healthy pullback when going off of the Fib Retracement is between 38.2-50% before the next run of a stock (remember, OTC stocks don't necessarily follow technical analysis; even regular stocks don't necessarily follow technical analysis, but they are more likely to than OTC stocks). Because of the data I have as of right now, PONGF could do one of two things: it could go through a consolidation phase in which it stays pretty stagnant between a certain area (which as of right now could be between 0.88 and 0.75) until the next run (I will share when it could possibly be a little later), or it could continue going down because of OTC stock volatility (or bad news). Now, if PONGF follows the technical analysis I have laid out, here is what could happen: PONGF could have this consolidation phase until the start of a run either sometime before the end of May, or right at the end of May. I have come to this possibility due to the Fib Time Zone. The Fib Time Zone (as stated in the Key) points out places in time where a stock could either hit a high, low, or reverse in either direction after running up/down (this doesn't necessarily have to be a major high, low, or reversal). If you look at at the spots that have already been passed through by PONGF in the Fib Time Zone, highs/lows/reversals have been pointed out. The minute that I see a for sure sign of the start of an uptrend, I am going in on PONGF. I won't be convinced of a start until I see the MACD (along with other indicators such as the Vortex and ADX/DMS indicators) indicate a buy signal.