The 21stcentury Trading Technique that CAN Predict the STOCKMARKET #MULTIDIAGONALS
Followers will be well aware of My Technique that regularly Highlights MAJOR Turning Points in the Stockmarket(indeed on ANY chart) I get asked Daily What are #MULTIDIAGONALS & WHY is it they Consistently Work?
I think to answer this I would First have to give a brief History of Stockmarket Technical Analysis
What is Technical Analysis(T/A) ?
It is the application of chart based Tools & Indicators to form FUTURE Predictions
What is Fundamental Analysis(F/A)?
This involves analysing a companies Financial Statements to provide 'fair value'
The drawback of F/A is the Data is Historic.. Fundamentals can & do change often dramatically..
Heres a Great Example..Look at Chart of #BP the
British multinational Oil&Gas Company
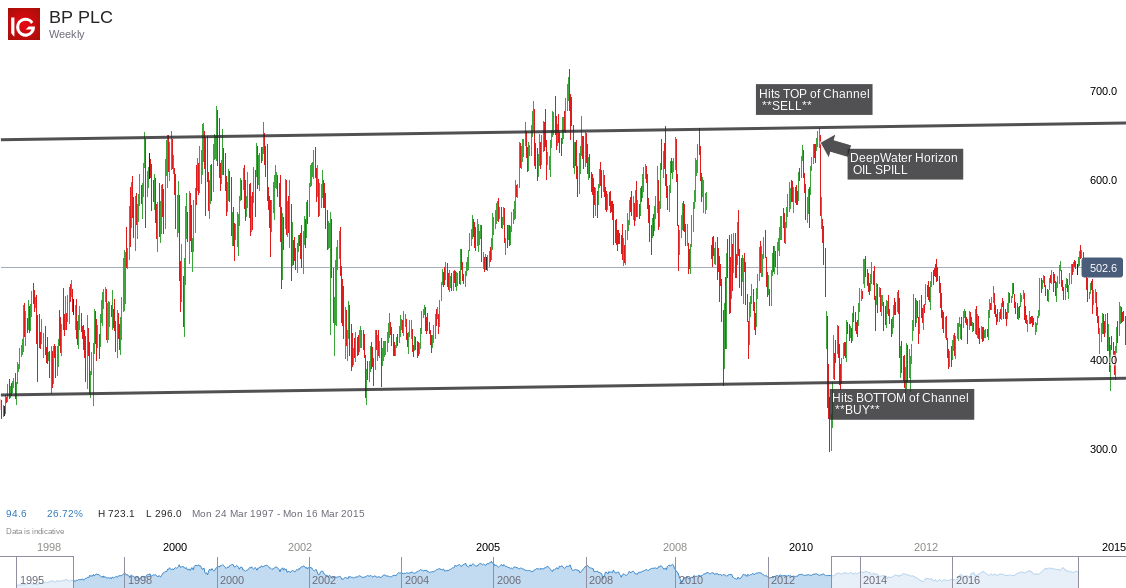
At the End of March 2010 the Shareprice had been Rapidly Increasing the 'fundamentals' looked great and many investors were keen to Buy However 'Technically' the Price was Hitting the *TOP of a Decade Long Channel its Here that the T/A was saying SELL Shortly afterwards BP sufferred the devastating Deepwater Horizon Oil Spill that went on for Weeks & Cost over $60 BILLION https://en.wikipedia.org/wiki/Deepwater_Horizon_oil_spill Immediately the fundamentals had changed the Investor using F/A was caught completely unawares. The T/A also was able to give the Lows..the BOTTOM of the Channel (you will often get some 'slippage' beyond the Lines during these BIG Moves)
So back to T/A lets start at the very beginning the First 'indicator' of price would have been the Trendline this is a Straight Line that is drawn over Highs or Lows to show prevailing direction of price you can draw BOTH together to create a CHANNEL(as shown on the #BP Chart)
This is actually a Brilliant yet Very Simple Tool Highly Effective at Predicting Price Actions & Very Underrated This was the Basis for my #MULTIDIAGONALS Technique unfortunately it is nowadays overlooked for more fanciful techniques that are frankly inferior
Another observation I have made is that Most practitioners(even Experienced) Fail to draw Trendlines & Channels correctly which skews results It is an art that has been neglected and many of the current principles simply arent True
You can see however that Channels & Trendlines arent 'Sexy' enough to Sell many Books you would require a lot of 'padding'
a bit like Writing a Diet Book that just says 'Eat Less Exercise More' which makes Perfect Sense but WONT Sell ANY Books..so Authors came up with much more 'sophisticated' and complex T/A techniques that mainly bamboozle DONT Work but have been Very Successful at Selling Books and filling auditoriums of naive but enthusiastic beginners to Trading ..I hope you enjoyed reading please retweet upvote
Next time I will show
**How conventional thinking on Trendlines is outdated and inaccurate
**Also Explain Other Forms of T/A and analysing their merits
Interesting! what is the rule to connect the line, some go over and I see some do not reach.
You just do it on sight ? if I connected the two highest peaks I get a different line so what are You looking for? thanks for showing
hi buddie its something I will expand on..like I said Trendlines have been disregarded for years in favour of 'sexier' methods and even experienced Traders havent mastered the correct way of applying diagonals