TRADE CRYPTO CURRENCY USING CANDLE STICK PATTERN SIGNAL
HISTORY
The Japanese began using technical analysis to trade rice in the 17th century. While this early version of technical analysis was different from the US version initiated by Charles Dow around 1900, many of the guiding principles were very similar:
- The “what” (price action) is more important than the “why” (news, earnings, and so on).
- All known information is reflected in the price.
- Buyers and sellers move markets based on expectations and emotions (fear and greed).
- Markets fluctuate.
- The actual price may not reflect the underlying value.
According to Steve Nison, candlestick charting first appeared sometime after 1850. Much of the credit for candlestick development and charting goes to a legendary rice trader named Homma from the town of Sakata. It is likely that his original ideas were modified and refined over many years of trading eventually resulting in the system of candlestick charting that we use today.
Formation
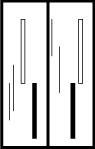
In order to create a candlestick chart, you must have a data set that contains open, high, low and close values for each time period you want to display. The hollow or filled portion of the candlestick is called “the body” (also referred to as “the real body”). The long thin lines above and below the body represent the high/low range and are called “shadows” (also referred to as “wicks” and “tails”). The high is marked by the top of the upper shadow and the low by the bottom of the lower shadow. If the stock closes higher than its opening price, a hollow candlestick is drawn with the bottom of the body representing the opening price and the top of the body representing the closing price. If the stock closes lower than its opening price, a filled candlestick is drawn with the top of the body representing the opening price and the bottom of the body representing the closing price.

THE MAJOR SIGNAL
 DOJI Recognition: The open and close are the same or very close to the same.Pattern Psychology: The Bulls and the Bears are conflicting. This is an alert to investors to take heed for possible trend reversal.
 BULLISH ENGULFING Recognition: The body of the second day completely engulfs the body of the first day. Shadows are not a consideration.Pattern Psychology: This pattern suggests the Bulls are stepping in with force, suggesting prices will move up.
 BEARISH ENGULFINGRecognition: The body of the second day completely engulfs the body of the first day. Shadows are not a consideration.Pattern Psychology: This shows the Bears are overwhelming the Bulls, suggesting prices will move down.
 HAMMERS and HANGING-MANRecognition: The lower shadow (or tail) should be at least two times the length of the body. The color of the body is not important although a black body has slightly more Bearish indications and a white body has slightly more Bullish indications.Pattern Psychology: This pattern at the bottom of a down trend is called a Hammer. This pattern at the top of an uptrend is called a Hanging-Man
 PIERCING PATTERNRecognition: A two candle pattern, the body of the first candle is black and the body of the second candle is white. The white day opens lower, under the trading range of the previous day. The price closes above the 50% level of the black body.Pattern Psychology: After a strong downtrend, the atmosphere is Bearish but before the end of the day the Bulls step in and price closes near the high of the day.
 Recognition: A two candle pattern, the body of the first candle is white and the body of the second candle is black. The black day opens higher, above the trading range of the previous day. The price closes below the 50% level of the white body.Pattern Psychology: After a strong uptrend, the atmosphere is Bullish but before the end of the day the Bears step in and price closes near the low of the day.
 BULLISH HARAMIRecognition: A two candle pattern forming in a down trending price pattern. The body of the first candle is the same color as the current trend and should be a long black candle. The body of the second candle is white and opens and closes within the body of previous day's candle.Pattern Psychology: After a strong downtrend the Bulls step in and open the price higher than the previous day's close. This concerns the Bears and the shorts start covering their postions. A strong day after that would convince everybody that the trend may be in a reversal.
 BEARISH HARAMIRecognition: A two candle pattern forming in an uptrending price pattern. The body of the first candle is the same color as the current trend and should be a long white candle. The body of the second candle is black and opens and closes within the body of the previous day's candle.Pattern Psychology: After a strong uptrend the Bears step in and open the price lower than the previous day's close. The price finishes lower for the day and the Bulls are concerned and begin taking their profits.
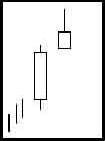
 MORNING STARRecognition: A three candle pattern at the bottom of a downtrend.The body of the first candle is black, confirming the current downtrend. The second candle is an indecisive formation. The third candle is white and should close at least halfway up the black candle.Pattern Psychology: After an apparant downtrend the Bulls step in and open the price higher than the previous day's close. The price finishes higher for the day and the Bears are concerned and begin covering their short positions.
 EVENING STARRecognition: A three candle pattern at the top of an uptrend. The body of the first candle is white, confirming the current uptrend. The second candle is an indecisive formation. The third candle is black and should close at least halfway down the white candle.Pattern Psychology: After an apparant uptrend the Bears step in and open the price lower than the previous day's open. The price finishes lower for the day and the Bulls are concerned and begin selling to take their profits.
 Kicker Signals
Bearish and BullishRecognition: The first day's open and the second day's open are the same BUT the price movement is in opposite directions.Pattern Psychology: The Kicker Signal demonstrates a dramatic change in investor sentiment. The longer the candles, the more dramatic the price reversal.
 SHOOTING STARRecognition: One candle pattern appearing in an uptrend. The shadow (or tail) should be at least two times the length of the body. The color of the body is not important, although a black body has slightly more Bearish indications.Pattern Psychology: After a strong uptrend the Bulls appear to still be in control with price opening higher, but by the end of the day the Bears step in and take the price back down to the lower end of the trading range. Lower trading the next day reinforces the probability of a pullback.
 Inverted HammerRecognition: The upper shadow should be at least two times the length of the body. The real body is at the lower end of the trading range. There should be no lower shadow or a very small lower shadow.Pattern Psychology: After a downtrend has been in effect, the atmosphere is Bearish. The price opens and trades lower but before the end of the day, The Bulls step in and take the price back up. A higher open or a white candle the next day reinforces buying.
EXAMPLE:

This are Major Pattern Signal Of Candle stick Pattern. Hope you learn! Thanks.