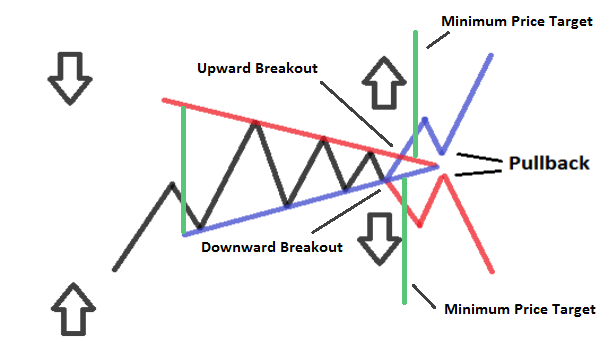
TA Patterns: Symetrical Triangle
The symmetrical triangle is formed by two converging trendlines conecting a series of peaks and troughs or Lower Highs and Higher Lows. This trendlines converge towards a center point.
Helps to identify Breakouts which can result in a downtrend or uptrend (breakout from the upper trendline => bullish trend/ breakout from the lower trendline => bearish trend)
Can be used to identify price targets or stop loss.
Price Target Example:
Symmetrical triangle that started at a low of $10.00 and move up to $15.00 before the price range narrows over time.
A breakout from $12.00 would imply a price target of $17.00 (15 - 10 = 5 + 12 = 17).
