HOW TO USE DEMAND AND SUPPLY IN INTRADAY TRADING USING ZERO INDICATOR DEMAND AND SUPPLY - PART-1
First thing first:-
Predicting price of a on going trading is very very difficult, so we need to analysis it properly for forecasting a price - there are two types of analysis we can do - First- Fundamental analysis and second is technical analysis. Fundamental analysis mostly used for investment purposes only and for Intraday swing trading Technical Analysis come into play.
So lets begins the topics....
Candle sticks is one of the most popular methods of gauging the market sentiment in proper manner. It is invented in Japan , Nowadays it is widely used in trading systems . Most of the trader use this because it is as simple and we can understand easily. It's color combinations and representation on charts so simple every one who have some basic knowledge can understand it properly.
We will use candle sticks as charting pattern for using this methods.
As there are four components like a bar chart, here are also four components is there..
OPEN - HIGH- LOW AND CLOSE
OPEN- Open price of the tradable instrument
HIGH - Instrument made high or high price that is called high
LOW - instruments made low which is recorded as low price
CLOSE- After certain time interval An instrument made close that that particular price is called close

Apart from that there is another few terms which are useful has been given bellow
BODY OF A CANDLE - Candle sticks has a wide part From CLOSE to OPEN is called body and filled with different colours. Depending on close point respect to Open we have BULLISHA AND BEARISH CANDLE STICKS , which is denoted various colours. Specially RED for bearish and Green for Bullish candle.
BULLISH CANDLE - If candle CLOSE price is greater than OPEN is called BULLISH candle and Denoted using GREEN (SOME ONE MAY CHANGE IT AS FIT FOR THEM)
BEARISH CANDLE - If CLOSE PRICE is less than OPEN price, then it is called Bearish candle and Denoted by RED in colour.
WICK OR SHADOWS- Sometimes candle sticks made with a high and and low and closed above low and bellow high which is denoted as sticks or vertical line which is called Shadows or wicks.

FEW CANDLE STICKS PATTERN - MAKING SINGLE CANDLE.
- HAMMER - WHEN BODY IS SMALL AND TAIL (LOWER SHADOW- WHICH IS SEEN IN DOWN TREND) IS MORE THAT 2-3 Times and upper shadow is small is called Hammer.

- Hanging man - If above Hammer formed during Uptrend which is called Hanging man

INVERTED HAMMER - when reversed hammer created in down trend is called inverted hammer.
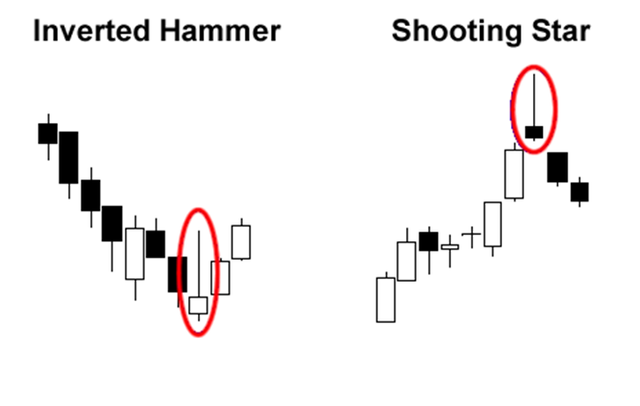
SHOOTING STAR - WHEN Inverted Hammer created in uptrend is called shooting star.

- MARUBUZU - When there is no upper and lower shadow is called marubuzu candle sticks pattern
A. BULLISH MARUBUZU - When OPEN=LOW and CLOSE=HIGH appears and close greater than open is called GREEN marubuzu or bullish marubuzu
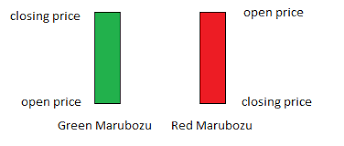
B. BEARISH MARUBUZU - When OPEN=HIGH and LOW=CLOSE appears and close less than open is called RED marubuzu or bearish marubuzu

- DOZI - When there is long upper and lower shadow occurs and open nearly equal to close real body is to tiny or disappear or open =close is called doji.
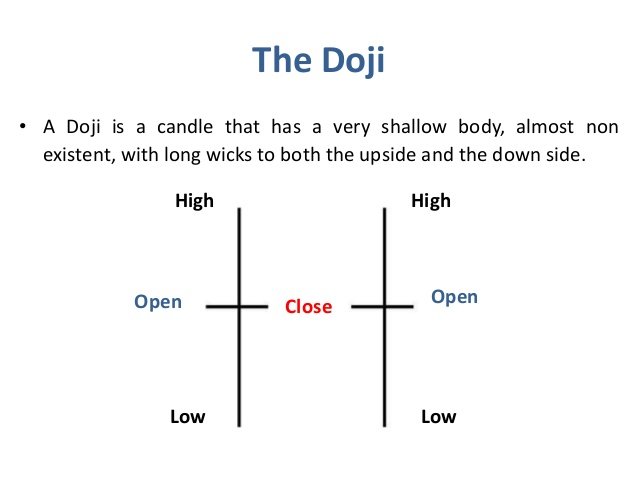

this type candle is occurs when market is in about to reverse. sometimes all of these things are failed, so be cautious as market sentiment is depends on market participants. So it is not a rocket science - it is probability game.!!!
so these is small introduction of candle sticks patters as we use these for Supply and demand trading systems in both intraday and positional . So this is and introductory part..
Hope it will help you who are trading in NSE / BSE Indian market or as well as other terminal using candle sticks patterns...
Is there anything missed please let me know using comments , it will help us to add those things in next part .
note - All images and pics has been taken from google...
Wait for the next Part- next part will be added soon.!!!
bro really helpfull post you teachs in very simple language wait for next
Informative post.
Thanks Borthers!!!
It is just Part -1 Brothers...
Complete part will be posted one by one!!!
nice info.
Thanks bro
https://steemit.com/bitcoin/@sandy666/binance-officially-made-over-usd500-million-profit-in-their-first-year-of-trading
Thanks @sandy666 ji , I have gone through your post and Really want to know one things...
Please let me know... Does Binance market supports or allow ETN - electronium trading facility???
I am waiting for your responses...
its very important article for newbies like me
Hey , nuwani taraka
@tutchpa
Thanks for your valubale feedback ... please don't hesitate to put yur feedback in next upcoming part series .
Done bro great information
https://steemit.com/jeff/@sdas/jeff-bezos-baceme-world-richest-person
Thanks bro!!!
Done to..
U have just summarised the whole content very well....keep working...u r doing great.
@Aniket-Singh , Brother thanks for your wishes !!!