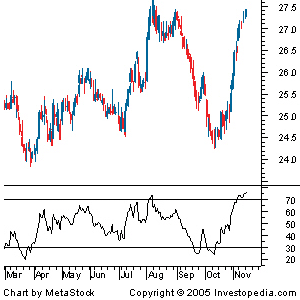
What is the Relative Strength Index - RSI
The relative strength index (RSI) is a momentum indicator developed by noted technical analyst Welles Wilder, that compares the magnitude of recent gains and losses over a specified time period to measure speed and change of price movements of a security. It is primarily used to attempt to identify overbought or oversold conditions in the trading of an asset.
BREAKING DOWN ‘Relative Strength Index – RSI’
The relative strength index is calculated using the following formula:
RSI = 100 – 100 / (1 + RS)
Where RS = Average gain of up periods during the specified time frame / Average loss of down periods during the specified time frame/
The RSI provides a relative evaluation of the strength of a security’s recent price performance, thus making it a momentum indicator. RSI values range from 0 to 100. The default time frame for comparing up periods to down periods is 14, as in 14 trading days.
Traditional interpretation and usage of the RSI is that RSI values of 70 or above indicate that a security is becoming overbought or overvalued, and therefore may be primed for a trend reversal or corrective pullback in price. On the other side of RSI values, an RSI reading of 30 or below is commonly interpreted as indicating an oversold or undervalued condition that may signal a trend change or corrective price reversal to the upside.
Tips on Using the RSI Indicator
Sudden large price movements can create false buy or sell signals in the RSI. It is, therefore, best used with refinements to its application or in conjunction with other, confirming technical indicators.
Some traders, in an attempt to avoid false signals from the RSI, use more extreme RSI values as buy or sell signals, such as RSI readings above 80 to indicate overbought conditions and RSI readings below 20 to indicate oversold conditions.
The RSI is often used in conjunction with trend lines, as trend line support or resistance often coincides with support or resistance levels in the RSI reading.
Watching for divergence between price and the RSI indicator is another means of refining its application. Divergence occurs when a security makes a new high or low in price but the RSI does not make a corresponding new high or low value. Bearish divergence, when price makes a new high but the RSI does not is taken as a sell signal. Bullish divergence that is interpreted as a buy signal occurs when price makes a new low, but the RSI value does not. An example of bearish divergence can unfold as follows: A security rises in price to $48 and the RSI makes a high reading of 65. After retracing slightly downward, the security subsequently makes a new high of $50, but the RSI only rises to 60. The RSI has bearishly diverged from the movement of price.
For more detailed information on the RSI indicator, see An Introduction To The Relative Strength Index and Relative Strength Index And Its Failure-Swing Points.
Full credits for this article to [investopedia.com](http://Full credits for this article to investopedia.com | This article has been sourced from: http://www.investopedia.com) | This article has been sourced from:http://www.investopedia.com/terms/s/stochrsi.asp


Appreciate for all your guide https://9blz.com/rsi-indicator-explained/