What is the "Moving Average" technical indicator?
Moving averages (MA) are one of the most popular and often-used technical indicators. The moving average is easy to calculate and, once plotted on a chart, is a powerful visual trend-spotting tool. You will often hear about three types of moving average: simple, exponential and linear. The best place to start is by understanding the most basic: the simple moving average (SMA). Let’s take a look at this indicator and how it can help traders follow trends toward greater profits. (For more on moving averages, see our Forex Walkthrough.)
Trendlines
There can be no complete understanding of moving averages without an understanding of trends. A trend is simply a price that is continuing to move in a certain direction. There are only three real trends that a security can follow:
- An uptrend, or bullish trend, means that the price is moving higher.
- A downtrend, or bearish trend, means the price is moving lower.
- A sideways trend, where the price is moving sideways.
The important thing to remember about trends is that prices rarely move in a straight line. Therefore, moving-average lines are used to help a trader more easily identify the direction of the trend. (For more advanced reading on this topic, see The Basics Of Bollinger Bands® and Moving Average Envelopes: Refining A Popular Trading Tool.)
Moving Average Construction
The textbook definition of a moving average is an average price for a security using a specified time period. Let’s take the very popular 50-day moving average as an example. A 50-day moving average is calculated by taking the closing prices for the last 50 days of any security and adding them together. The result from the addition calculation is then divided by the number of periods, in this case 50. In order to continue to calculate the moving average on a daily basis, replace the oldest number with the most recent closing price and do the same math.
No matter how long or short of a moving average you are looking to plot, the basic calculations remain the same. The change will be in the number of closing prices you use. So, for example, a 200-day moving average is the closing price for 200 days summed together and then divided by 200. You will see all kinds of moving averages, from two-day moving averages to 250-day moving averages.
It is important to remember that you must have a certain number of closing prices to calculate the moving average. If a security is brand new or only a month old, you will not be able to do a 50-day moving average because you will not have a sufficient number of data points.
Also, it is important to note that we’ve chosen to use closing prices in the calculations, but moving averages can be calculated using monthly prices, weekly prices, opening prices or even intraday prices. (For more, see our Moving Averages tutorial.)
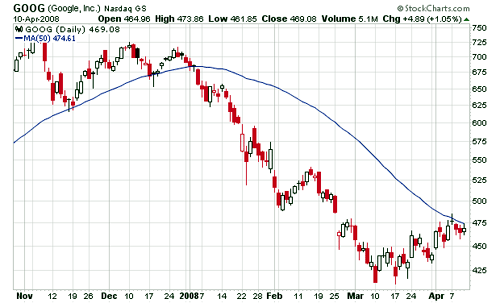
 Figure 1: A simple moving average in Google Inc.Source: StockCharts.comFigure 1 is an example of a simple moving average on a stock chart of Google Inc. (Nasdaq:GOOG). The blue line represents a 50-day moving average. In the example above, you can see that the trend has been moving lower since late 2007. The price of Google shares fell below the 50-day moving average in January of 2008 and continued downward.
When the price crosses below a moving average, it can be used as a simple trading signal. A move below the moving average (as shown above) suggests that the bears are in control of the price action and that the asset will likely move lower. Conversely, a cross above a moving average suggests that the bulls are in control and that the price may be getting ready to make a move higher. (Read more in Track Stock Prices With Trendlines.)
Other Ways to Use Moving Averages
Moving averages are used by many traders to not only identify a current trend but also as an entry and exit strategy. One of the simplest strategies relies on the crossing of two or more moving averages. The basic signal is given when the short-term average crosses above or below the longer term moving average. Two or more moving averages allow you to see a longer term trend compared to a shorter term moving average; it is also an easy method for determining whether the trend is gaining strength or if it is about to reverse. (For more on this method, read A Primer On The MACD.)
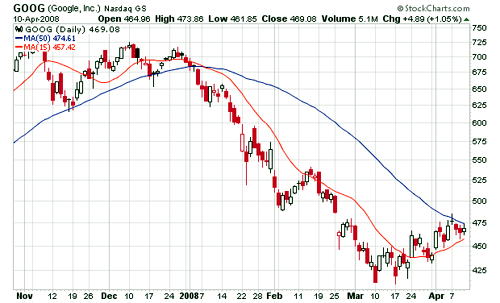
 Figure 2: A long-term and shorter term moving average in Google Inc.Source: StockCharts.comFigure 2 uses two moving averages, one long-term (50-day, shown by the blue line) and the other shorter term (15-day, shown by the red line). This is the same Google chart shown in Figure 1, but with the addition of the two moving averages to illustrate the difference between the two lengths.
You’ll notice that the 50-day moving average is slower to adjust to price changes, because it uses more data points in its calculation. On the other hand, the 15-day moving average is quick to respond to price changes, because each value has a greater weighting in the calculation due to the relatively short time horizon. In this case, by using a cross strategy, you would watch for the 15-day average to cross below the 50-day moving average as an entry for a short position.
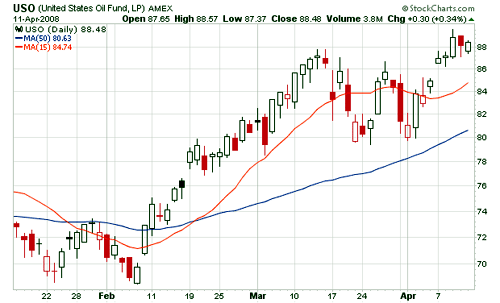
 Figure 3: A three-monthSource: StockCharts.comThe above is a three-month chart of United States Oil (AMEX:USO) with two simple moving averages. The red line is the shorter, 15-day moving average, while the blue line represents the longer, 50-day moving average. Most traders will use the cross of the short-term moving average above the longer-term moving average to initiate a long position and identify the start of a bullish trend. (Learn more about applying this strategy in Trading The MACD Divergence.)
Support and Resistance
Support and resistance, or ceilings and floors, refer to the same thing in technical analysis.
- Support is established when a price is trending downward. There is a point at which the selling pressure subsides and buyers are willing to step in. In other words, a floor is established.
- Resistance happens when a price is trending upward. There comes a point when the buying strength diminishes and the sellers step in. This would establish a ceiling. (For more explanation, read Support & Resistance Basics.)
In either case, a moving average may be able to signal an early support or resistance level. For example, if a security is drifting lower in an established uptrend, then it wouldn’t be surprising to see the stock find support at a long-term 200-day moving average. On the other hand, if the price is trending lower, many traders will watch for the stock to bounce off the resistance of major moving averages (50-day, 100-day, 200-day SMAs). (For more on using support and resistance to identify trends, read Trend-Spotting With The Accumulation/Distribution Line.)
Bottom Line
Moving averages are powerful tools. A simple moving average is easy to calculate, which allows it to be employed fairly quickly and easily. A moving average’s greatest strength is its ability to help a trader identify a current trend or spot a possible trend reversal. Moving averages can also identify a level of support or resistance for the security, or act as a simple entry or exit signal. How you choose to use moving averages is entirely up to you.
For further reading on moving averages, check out Simple Moving Averages And Volume Rate-Of-Change and Basics Of Weighted Moving Averages.
Full credits for this article to [investopedia.com](http://Full credits for this article to investopedia.com | This article has been sourced from: http://www.investopedia.com) | This article has been sourced from: http://www.investopedia.com/articles/technical/052201.asp

Congratulations @coincheckup! You have completed some achievement on Steemit and have been rewarded with new badge(s) :
Click on any badge to view your own Board of Honor on SteemitBoard.
For more information about SteemitBoard, click here
If you no longer want to receive notifications, reply to this comment with the word
STOPCongratulations @coincheckup! You have completed some achievement on Steemit and have been rewarded with new badge(s) :
Click on any badge to view your own Board of Honor on SteemitBoard.
For more information about SteemitBoard, click here
If you no longer want to receive notifications, reply to this comment with the word
STOP