Transitive Closure in a simple visual
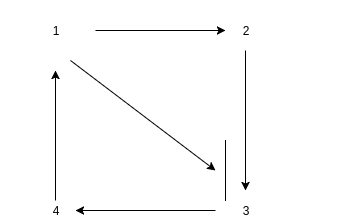
The visual you see above is central to understanding the transitive closure of a digraph example from TML which Ohad discusses on Github. A digraph is also known as a directed graph and we call it a directed graph because it is composed of nodes and edges where the arrows in the picture represent the direction or flow of the connections in the directed network. A directed graph only flows in one direction as shown by the arrows.
Nodes are the points which we see represented as numbers.
Vertices are the lines which we see represented as arrows.
Recorded in the path can actually be a computation. We see at the end it terminates.
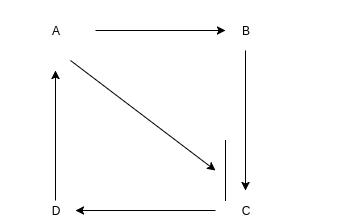
For example if we let those numbers become letters:
Now it becomes a lot more obvious how information can be included in the path.
Think of ABCD | ABCD as a column or set. Then by using a matrix we can map the letters to make it much more clear. The map will allow you to see how there is a path and that can be labeled by 1 or 0. You can also denote it as Ohad does it in his example by using 1,2,3,4 to represent the same. We get {(1,2)(2,3)(3,4)}
How about we now think of it as Alice, Bob, Chuck, and Dave. This now represents the relations between people which can be represented as tuples.
We can also see clearly the transitive closure is (1,3), (2,4) -> (1,4).
Or more precisely: T={(1,2), (2,3), (3,4)(1,3),(2,4),(1,4)}
T itself is also a graph with the additional edges, because T constructs an output graph from an input graph.
For more, see the work of Ohad Asor: https://github.com/idni/tau


I would really love to understand whatz really going on here...lol, am so lost. Are you talking about how information circulates or how people are interconnected through networks? Don't get
Take a look at the linked TML Git. The transitive closure is explained in more detail.