Positive Returns

As an investor, I am fully committed (at least within my power) to the Environmental, Social & Governance investment framework, otherwise known as ESG and formerly known as Socially Responsible Investing or SRI. There are a multitude of investment products offered by a long and sometimes questionable list of financial service providers. The biggest of them, Merrill Lynch, Goldman Sachs and Morgan Stanley are the largest and well known recent entrants in to the burgeoning thematic space.
There have been, of course, some debate over the correlation of investment returns and investments labeled ESG. In her study, Stock Returns in Relation to Environmental, Social and Governance Performance: Mispricing or Compensation for Risk?, Cristana Manescu analyzed the returns of the S&P 500 and the DS400 indexes using seven ESG performance indicators; Community Relations, Corporate Governance, Diversity, Employee Relations, Environmental, Human Rights and Product Safety. From her study, Manescu found that “only community relations were found to have a positive effect on risk-adjusted stock returns”1, however she also states that security mispricing may also contribute to stock performance and behavior. While there are several studies that both support and refute the causal relationship between returns and ESG-based metrics, this post is not focusing on that analysis. Being the nerd that I am, I wanted to look at yet another level of analysis with this topic, this one related specifically to ESG metrics at the state level. While investors of course do not invest in the states themselves, when we invest in companies across the globe, we want to make sure that where they are doing business, the locale, generally aligns with the same or similar metrics as individual investments.
The Data
To build out the ESG state metric, I went in search of data that aligned with each of the three pillars, Environmental, Social and Governance. I discovered that data using two different indices; the Environmental Performance Index (EPI), and the Worldwide Governance Indicators (WGI). These indicators will provide the basis for my State ESG Index Score (SEIS). I applied an equal weight to both the EPI and the WGI to create my composite SEIS score. A more recent index that measures global social progress called the Social Progress Index (SPI) analyzes three basic pillars of social progression using 53 different indicators. Unfortunately, I could not use this index due to lack of data history but will be following this data set in future analyses.
Environmental Performance Index
“The EPI is a project lead by the Yale Center for Environmental Law & Policy (YCELP) and Yale Data-Driven Environmental Solutions Group at Yale University (Data-Driven Yale), the Center for International Earth Science Information Network (CIESIN) at Columbia University, in collaboration with the Samuel Family Foundation, McCall MacBain Foundation, and the World Economic Forum.” 2
Worldwide Governance Indicators
“The WGI reports aggregate and individual governance indicators for over 200 countries and territories over the period 1996–2015, for six dimensions of governance:
Voice and Accountability
Political Stability and Absence of Violence
Government Effectiveness
Regulatory Quality
Rule of Law
Control of Corruption
These aggregate indicators combine the views of a large number of enterprise, citizen and expert survey respondents in industrial and developing countries. They are based on over 30 individual data sources produced by a variety of survey institutes, think tanks, non-governmental organizations, international organizations, and private sector firms.” 3
The Hypothesis
While there has been some empirical evidence that suggests that ESG performance indicators have a positive, causal effect on stock returns, I am hypothesizing that we will observe a similar, positive correlation between stock index returns and the SEIS Index.
H01 = There is a correlation between SEIS and Stock Market Returns
HA1 = There is no correlation between SEIS and Stock Market Returns
I also wanted to explore a possible relationship between GDP and the SEIS Index Score. I hypothesize that there will be a positive relationship between a country’s GDP and the SEIS Index Score as richer countries are perceived to have the means, both politically and economically, to address issues related to ESG topics more readily than less-rich countries that may have to face a myriad of both social and economic issues.
H02 = Correlation between SEIS and Stock Market Returns for Developed countries
HA2 = No correlation between SEIS and Stock Market Returns for Developed countries
H03 = Correlation between SEIS and Stock Market Returns for Emerging Market countries
HA3 = No correlation between SEIS and Stock Market Returns for Developed countries
The Study
First, I wanted to determine which global stock markets had a tradeable and liquid index of stocks. Next, I pulled the EPI and WGI 2004 – 2012 data from those identified countries in to R, a language and environment for statistical computing and graphics. Once again, I combined the two scores with equal weight to create the SEIS Index. To ensure that we get a good market and country representation to prevent unintentional skewing, I coded Market Type (Developed and Developing) and Region in to R for each country.
In terms of Market Type, we get a relative good representation with 24 Developed Markets and 19 Developing Markets. In terms of Region, we see a bit less diversity with European countries dominating the study at 18, followed by Eastern Europe (5), Asia (4), Middle East (4) and South Asia (4) comprising the top five regions.
SEIS Index vs. GDP
The first study was the relationship between the SEIS Index 2012 and state GDP 2012. I extracted the nominal GDP in US dollars for each country for 2012. GDP was provided by the World bank and was accessed using the Quandl data aggregation platform.
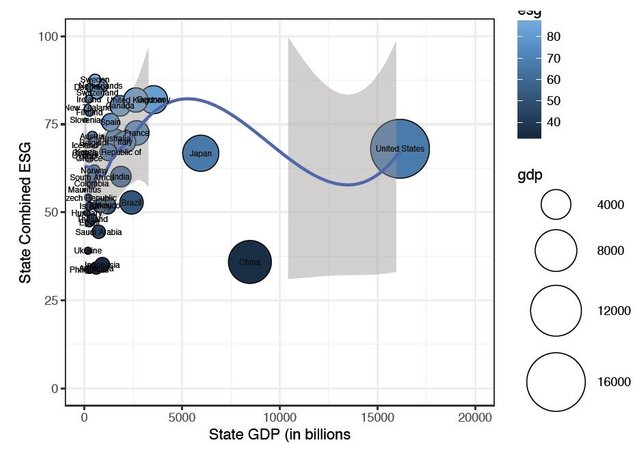
From this study, we see very little correlation between State GDP and the SEIS (correlation of -0.0002), the test is not even statistically significant with a p-value of 0.9991.
SEIS vs. Average Annual Index Returns
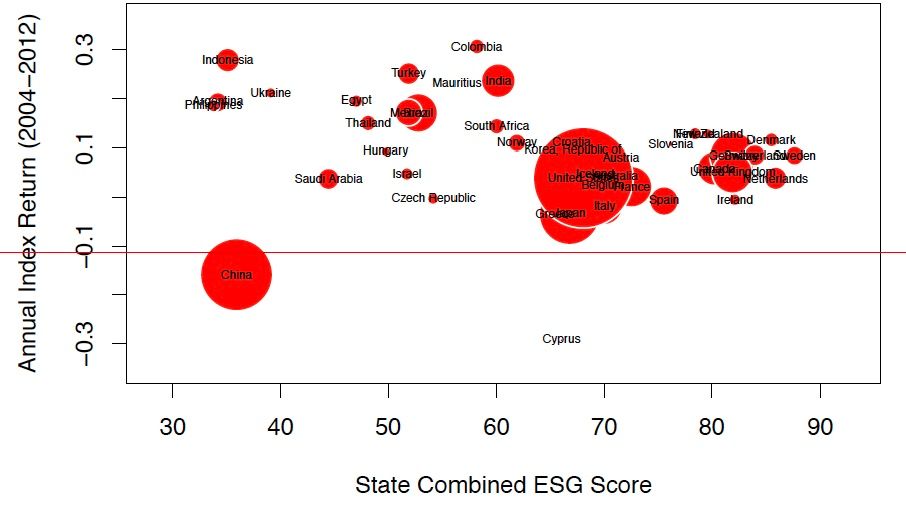
The second study compared the relationship between the SEIS Index 2012 and the average annual index returns of global stock for 2012. I calculated the average annual returns using R. Data was accessed using the Quandl data aggregation platform, data feeds were provided by YAHOO, and the World Federation of Exchanges.
While statistical significance has improved (p-value 0.048), we see only a slight negative correlation between Annual Index Returns and the SEIS (-0.30) which, even at its weakest level, does not bode well for my assumptions. At this point we can accept the null hypothesis that the SEIS index drives stock market returns however, the correlation is negative and relatively weak.
Isolation – Comparing Markets and the SEIS
From a combined perspective, it appears that GDP is independent from the SEIS score. We also do not see much of a correlation between Annual Index Returns and the SEIS. My next test is to isolate the two market types, developed and emerging, and compare their GDP and their SEIS scores to test my second and third hypothesis, that there is some type of connection between environmental stewardship, social responsibility, good governance and stock market returns.
SEIS Index vs. Developed Markets – GDP and Average Annual Returns
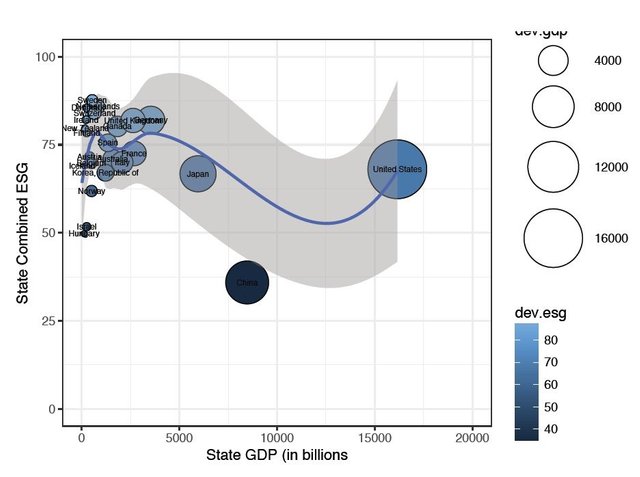
Same picture as presented above, but this time I isolated the developed markets. Once again, we get a negative correlation (-0.295) meaning as GDP increases the SEIS Index falls. We could have some skewness created by the U.S.

Here is where things get a little interesting. We have a p-value of 0.0158, so we can say it IS statistically significant and we are getting a slightly stronger POSITIVE correlation between the SEIS Index and the respective country’s stock market index returns (0.486).
SEIS Index vs. Emerging Markets – GDP and Average Annual Returns
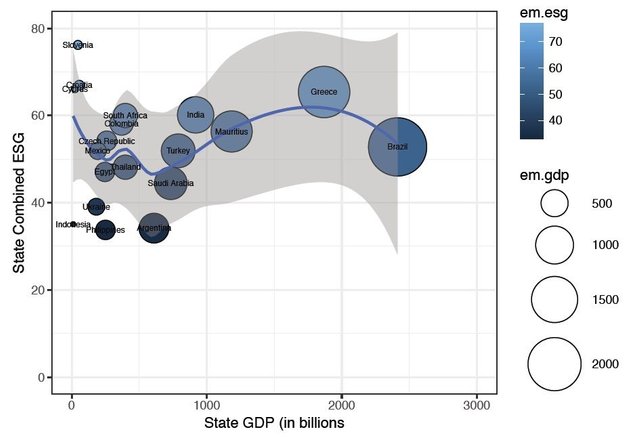
Correlation is positive here, albeit small (0.098). We are flirting with the statistical significance here with a p-value of 0.079.
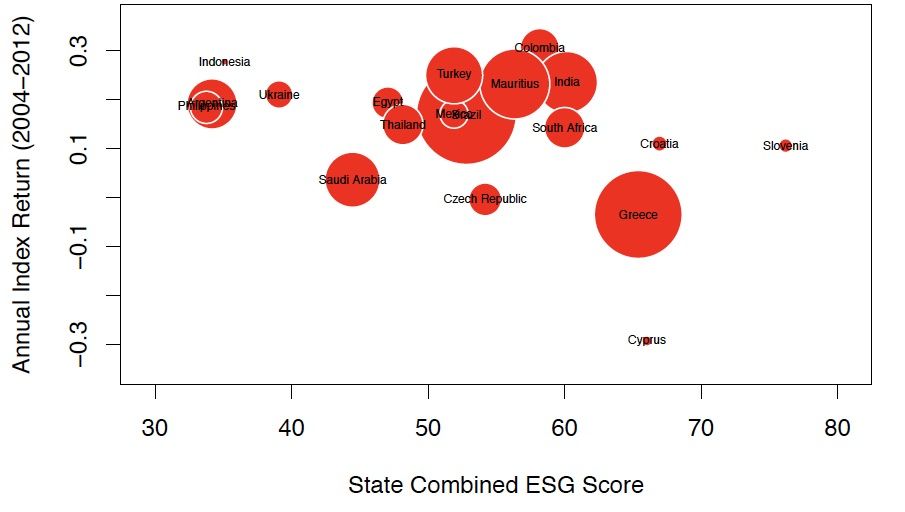
For this analysis, we have to reject the null hypothesis as the p-value is 0.079 and accept the alternative hypothesis that there is no correlation between a country’s ESG score and its stock market returns.
Returns vs. Returns
Finally, I wanted to break out the EPI and the WGI to see if one of the SEIS components had more of a positive effect on my assumptions. With this approach, I wanted to analyze the delta in the EPI and WGI scores of each country. I labeled these, Annual EPI and WGI Index Returns. I then plotted this data against the global Annual Stock Index Returns of each nation.

Looking at the stock market returns vs. the segregated EPI Index (once again this is the Environmental Performance Index), we do see some statistical significance but weak correlation (0.295). When it comes to governance and stock market returns, we do not see statistical significance.
Conclusion
So let’s review my hypotheses again:
H01 = There is a correlation between SEIS and Stock Market Returns
HA1 = There is no correlation between SEIS and Stock Market Returns
We can accept this hypothesis but this is not the outcome that I was hoping for, that the higher the SEIS Index, the greater the stock market returns. In fact, the test shows that this relationship is slightly negative. From a macro perspective, an state-centric ESG approach will not have a positive impact on your portfolio if you choose to invest in the indexes of the markets.
H02 = Correlation between SEIS and Stock Market Returns for Developed countries
HA2 = No correlation between SEIS and Stock Market Returns for Developed countries
Once again, we can accept this hypothesis and we could say that there MAY be some type of correlation albeit relatively weak. This supports my comment above that there will be a positive relationship between a country’s GDP and the SEIS Index Score as richer countries are perceived to have the means, both politically and economically, to address issues related to ESG topics more readily than less-rich countries that may have to face social and economic issues.
H03 = Correlation between SEIS and Stock Market Returns for Emerging Market countries
HA3 = No correlation between SEIS and Stock Market Returns for Developed countries
Lastly, we can reject this hypothesis as there is no statistical significance between my SEIS Index and the stock market returns of emerging economy countries. While I still believe that ESG-centric metrics will continue to attract capital and provide value for investors going forward, we do not see that impact during the longitudinal period analyzed. I believe that continued analysis will be imperative to track the impacts on socially responsible investment. An analysis of future periods would be appropriate, as ESG-centric investing continues to attract institutional and retail capital in addition to a lag analysis as there may be a lag effect between the improving ESG environment in countries and the stock market returns.
Manescu, Cristiana. “Stock Returns in Relation to Environmental, Social and Governance Performance: Mispricing or Compensation for Risk?” Sustainable Development, no. 19 (2011): 95-118.
“Environmental Performance Index – Development,” About EPI | Environmental Performance Index – Development, , accessed February 07, 2017, http://epi.yale.edu/about.
Worldwide Governance Indicators. 2016. Accessed February 09, 2017. http://www.info.worldbank.org.
Compelling data and an interesting post! I've just recently posted twice about Sustainable Responsible Investing, though a little less academically driven you may still be interested. Upvote and follow back! https://steemit.com/investing/@mrfunkymonk/socially-responsible-investment-a-bigger-piece-of-the-cheese-ecotrain