Not so bad, but not so good either.

It seems like it's been awhile since my last post...I can blame my day job for that! In my last post, I built out the model framework for analyzing and assessing state-centric issues related to ESG concepts. The next step in the process was to create a framework or identify a single ESG rating source to drill down to the company-specific level in this journey. Finally, and here is where it gets fun (I'm a nerd), analyze my wife and I's current portfolio within the ESG model framework and compare the findings to the Investment Policy Statement (IPS) I created a few months ago. In this post I will report a summation of the findings from the model.
Company-specific rating
I've been looking at several company - specific ESG metric ratings methodology solutions for the better part of they year. I happened to stumble upon a group based in Luxembourg called RepRisk. Their ESG ratings methodology is pretty impressive using the combination of Big Data, data scraping and human verification and input to construct a reputation risk score that reprices daily. This score is called the RRI score and ranges from 1 - 100, 1 being the best 100 being the worst. This index scoring is inverse to my state-centric TIM (Total Investable Market) ESG Index. I addressed this issue in the model. The methodology of RepRisk can be found HERE.
Throwing it into the model
The first step was to break out the top 20 holdings of each of our equity mutual funds we hold in our 401(k) accounts. I limited the analysis to this group as they are the bulk of our financial assets (92.0%). When I did this, I wanted to know the answers to the following broken into different metric buckets:
ESG Risk
- TIM ESG Index Score
- RRI Score
- Oil and gas exposure (Y/N)
- Peterson Ratio (yes this is mine, and is a work in progress and someone may shoot a hole in it, more than likely one of my colleagues! Calculation is similar to Sharpe Ratio...(Average Returns - Risk Free Rate)/(RRI Score)/100)#
Return Metrics
- 10-year return of top 20 holdings
- Return Risk Metrics
Standard deviation of returns*
- Beta**
- Sharpe Ratio***
- Sortino Ratio****
Valuation Metrics
- Price/Earning (P/E) Ratio
- Price/Earnings Growth (PEG) Ratio
- Price/Book Value
- Price/Sales
- Earnings Yield
Next, I broke out each our holdings by investment style
- U.S. Large Cap
- Mid & Small Cap
- Large Cap Developed
- Developing Market, and
- Bond/Fixed Income (I'm not going to show the outcome on here as its pretty boring..mostly U.S. Treasurys).
In this analysis, I will focus on the ESG metrics. So here are the findings.

Let's start with U.S. Large Caps. A few things stick out here. First let's look at the RRI score. While on a weighted average basis, the metric reading is in the middle of the medium risk band, there are 15 companies that have an RRI of 50 or greater which has lowered the Peterson Ratio (the higher the ratio the better). Next, while I would prefer NO oil & gas exposure in my top 20, 8.4% of my U.S. Large Cap portfolio is not too bad.
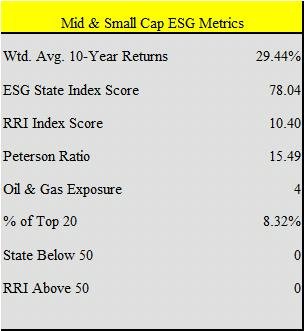
Next on to Mid and Small Cap stocks. The biggest difference as you can see are the RRI and Peterson Ratio scores. I will address that a bit later. Once again, I would prefer 0, but 8.3% of our small and mid cap portfolio is in oil and gas.
Large Cap companies in developed, mostly European countries look very strong from a TIM ESG Index view as many Western European countries have very high index scores. While the TIM ESG Index score looks good, the RRI score only fared slightly better than the RRI score of the Large Cap U.S. portfolio. And with 10-year average returns that are approx. 4.0% less than that of the U.S. Large Cap, the Peterson Ratio looks anemic. Finally a whopping 15.0% of our top twenty is invested in oil and gas companies.

Finally we have our Developing Markets metrics. As expected, the TIM ESG Index Score was significantly lower. What was surprising was the very low RRI Index Score. There was one thing in common between this data set and the Mid and Small Cap data set, relatively small market capitalizations (USD22bn for our M&S holding and USD48bn for our Developing Market portfolio). Hmm...things are getting interesting.

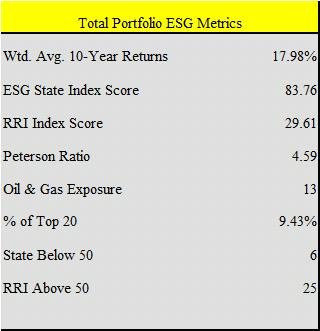
And now the summary statistics. They don't appear to be too bad, however it would be nice to minimize or completely eliminate our oil and gas exposure.
Now let's revisit the whole observation of the RRI rating and market capitalization. The hypothesis; if your portfolio overall has a larger market cap, your RRI will be higher. Vice versa for a small cap portfolio. So said in geeky math terms, there may be a positive correlation between market cap and the RRI score. So let's run the numbers.
After running a correlation analysis (Market Cap vs. RRI Index Score) we see that there is a 0.624 or 62.4% correlation between size and the index. Now the question, is there size bias for news and data? Can we assume that more people are concerned about large cap stocks than they are small-cap stocks? More news sources, more reporters = the possibility of more negative occurrences? Or is it simply a function of larger companies tend to violate ESG concepts ALOT more than smaller companies!?

I decided to run this potential "size bias" against my Peterson Ratio. The outcome was less compelling with only a slight negative correlation (-0.312).

Conclusion
While our overall Top 20 exposure to oil and gas is a relatively low at 9.0%, this metric violates Section VII of our IPS therefore I must find a way to immunize this position. Lastly, I'm a bit concerned about the strong positive correlation between company size and the RRI Index, especially since my beloved Apple has one of the highest RRI readings! There may be the possibility to de-emphasize large-cap stocks or to, immunize or hedge out certain positions in an large-cap index fund or ETF.
Notes:
I wanted to think about the incremental return for each tick of positive or negative ESG Index outcome. The question, are the returns high at the expense of ESG related concepts. The higher the Peterson Ratio, the better the quality of returns from an ESG perspective, e.g.

- Standard deviation of returns: The amount the average returns of the portfolio varies from the mean return. The higher the standard deviation, the higher the perceived risk of the portfolio.
** Beta: measure of the volatility, or systematic risk, of a security or a portfolio in comparison to the market as a whole. (I just finished reading chapter 23 of Richard Thaler's Misbehaving. The Making of Behavioral Economics, where he claimed "beta is dead" along with the CAPM model. I will disclose that I'm not a strong supporter of the Efficient Market Hypothesis due to the fact that market participants are irrational humans driven by two primal instincts...fear and greed.
*** Sharpe Ratio: The measure for calculating risk-adjusted returns.

**** Sortino Ratio: The standard deviation of negative returns. A large Sortino Ratio indicates there is a low probability of a large loss.

This post has been ranked within the top 80 most undervalued posts in the first half of Mar 17. We estimate that this post is undervalued by $1.48 as compared to a scenario in which every voter had an equal say.
See the full rankings and details in The Daily Tribune: Mar 17 - Part I. You can also read about some of our methodology, data analysis and technical details in our initial post.
If you are the author and would prefer not to receive these comments, simply reply "Stop" to this comment.
You should post more! This is good stuff.