Stock Market Dropping It Like It's Hot
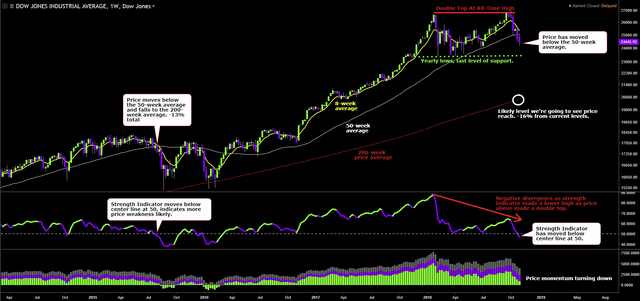
Haven't touched a single stock since April of 2017 when I left traditional markets for crypto. Earlier this month I happened to look at a chart of the Dow Jones and caught a bearish divergence between price and the strength indicator below. Was tempted to throw some money back into my trading account and short that motherfucker, but passed... regretfully. This is a weekly chart of the Dow Jones Industrial Average(top 30 stocks) so each price candle here represents 1-week of price action, green are up weeks, purple down weeks. After making a double top, bearish divergence and falling below my main trading line(8-period average), price has now fallen below the 50-week price average with the strength indicator below the chart moving below it's center line. The last time both of these events occurred at the same time was August 2015 and the market fell another -13% to the 200-week price average. A repeat here looks likely which means that the Dow Jones Average has another -16% to fall. Watching the yearly lows for possible for support, but after wiping out all of 2018's gains in three weeks the market looks hungry to eat up some of 2017's gains too.
If nothing else, maybe we can finally get those traditional traders to stfu when they say that Bitcoin and crypto is a bubble once they watch their precious profits go bye-bye in the even bigger bubble that is global stock markets.