Weekly Market Report 2018.09.14
This is my first weekly market report. I have handpicked 5 stocks that can make major moves within the coming days, weeks, and months. Please let me know if you have any thoughts or comments.
WEEKLY MARKET REPORT
By Moksh Rajput
Friday September 14, 2018
It looks like there a lot of great opportunities in the market right now. Dally not,
Lets dive right in…
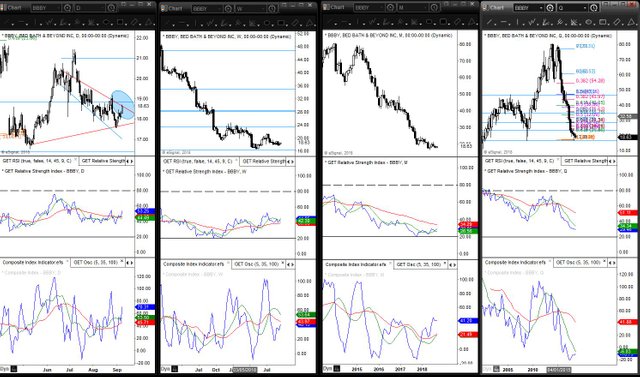
BBBY, Bed Bath & Beyond looks like a good buy ONLY if it goes above $19. The take profit point for BBBY in Daily would be $21 and if it breaks that then would be $23. Weekly chart is looking quite strong, so if BBBY can penetrate through $23 then we would be looking at $28.25. Stop loss would be just under the recent low, which is $16.57. My stop loss would be $16.40.
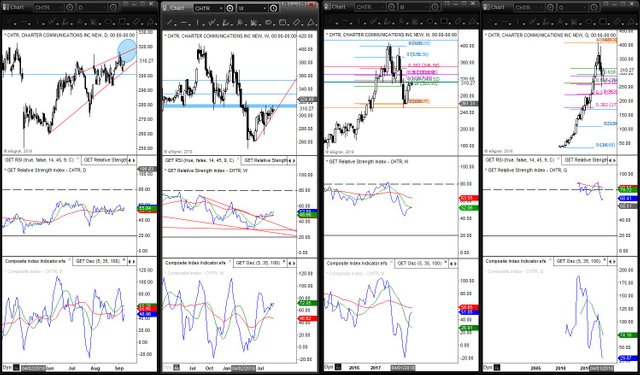
CHTR, Charter Communications Inc is a buy from my weekly signals. If CHTR can break above the upper trendline drawn in the Daily chart around $318 then we can expect the stock to go to $333 and if that is broken then $350. I would put a tight stop loss just under the lower trendline in Daily chart at $300.00.
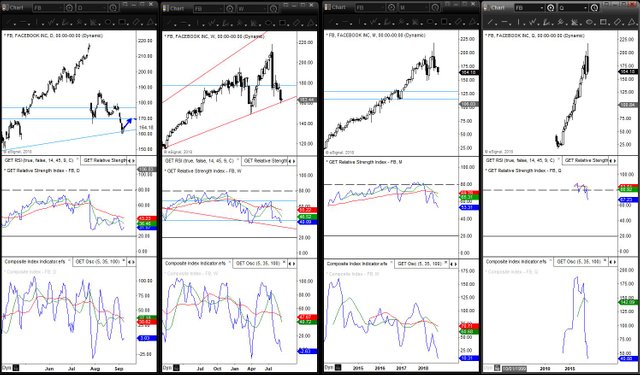
Not a right time to short FB, Facebook. FB may see a little rebound to $169.97 and play around there for couple of days and shoot up to $177 in the couple of weeks thereafter. In those couple of weeks, we will be nearing the markets favorite topping month, October. As well as the market rise, the Moving Avgs in the RSI will be coming down to once again revert the trend.
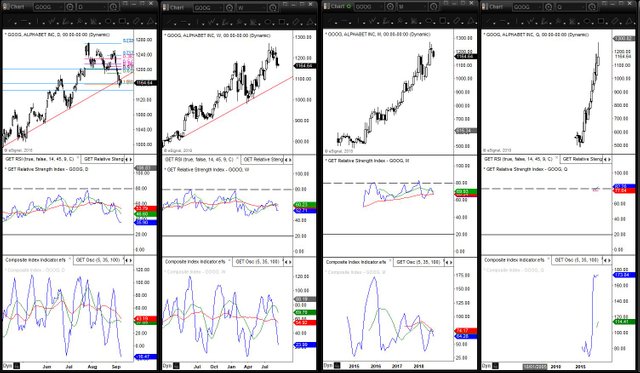
In Weekly, GOOG, Alphabet Inc, is still a short. Nothing too much, if you shorted GOOG then it might be a good time to take some profits, definitely not a good time to open new shorts. Daily RSI is looking to revert. A couple of Fibos’ on the chart and it is clear that the area $1160-1165 is a clear area of support. GOOG is likely on the rise to $1200. New shorts may be put there…time will tell…
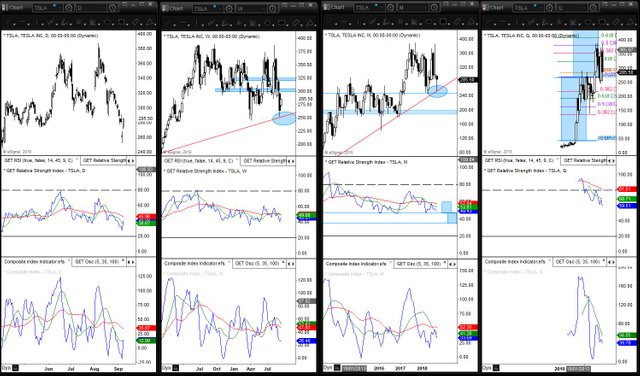
I love Tesla Cars, except the all electric thing. Anyway, the Tesla Stock, TSLA, looks like it is in trouble. After Musk tweeted the “Thinking about taking Tesla private at $400” tweet it crashed over 30%. In the Weekly chart it is seen that Tesla rebounded from the bottom trend line in the monthly chart at $251. IF tesla can break $250 AND the RSI breaks 46.25, then we can expect TSLA go all the way down to the support region of $200-$190 and RSI will plummet down to 34.5. Only short if TSLA breaks the red trendline.
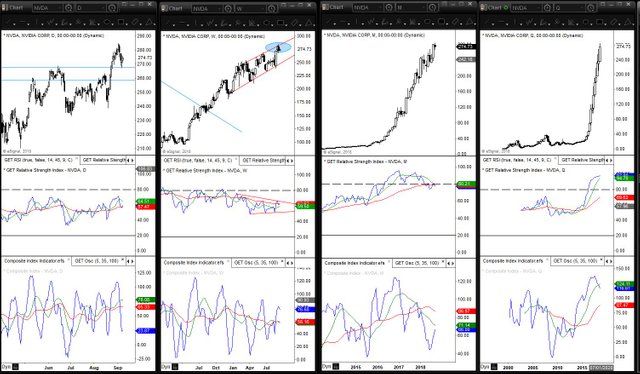
NVDA, Nvidia Corp. In Monthly context, my signal is giving me a short sign. I would only enter after NVDA breaches the recent low, $268. In the daily chart, if it breaks, the next stop would be at $258.50, and in the weekly, the lower red trendline, around $250-$253 would be a major support as it has been respecting it for over 9 months. My stop would be at $290.99.
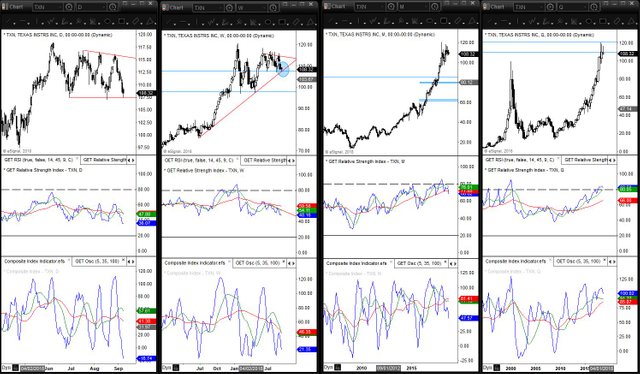
If TXN, Texas Instrs Inc, can break $106.50 (see blue circle in weekly chart), it would be a lovely short. The stop loss would be just above the upper trendline, around $115.50 and the weekly take profit point would be around $100. If $106 is not broken, TXN can rush all the way back up to $114-115. In the monthly and quarterly terms, this stock can go down to all the way to $80 and $62-65. In the quarterly chart it is seen that the stock is rejecting the prices $108-$120. We can see major wicks happening in this area for the past three quarters! Definitely bearish…
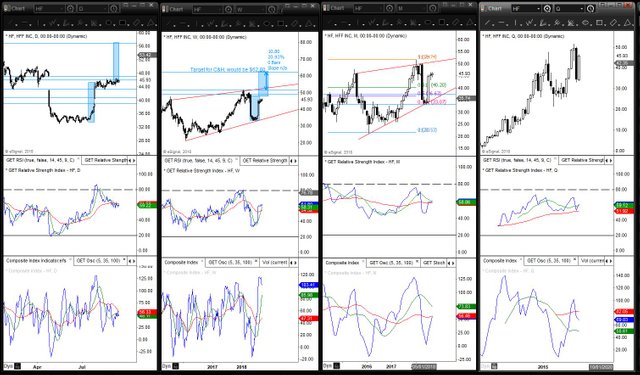
HF, HFF Inc, is setting up for a classical buy signal. Weekly RSI has confirmed the bullish run, execpt the price needs to break $48.82, above the cup and handel for our first buy signal. They final confirmation would be when it breaks around $52, to a new ATH (All Time High).Even if we enter after $52 is closed for the week, then the profit potential is still a staggering 20%. I believe the breakout would occur before the new year.Note, in the weekly chart, the upper red trendline also comes around the area of $52, this gives us more confirmation that if $52 breaks then we can see $62.80.
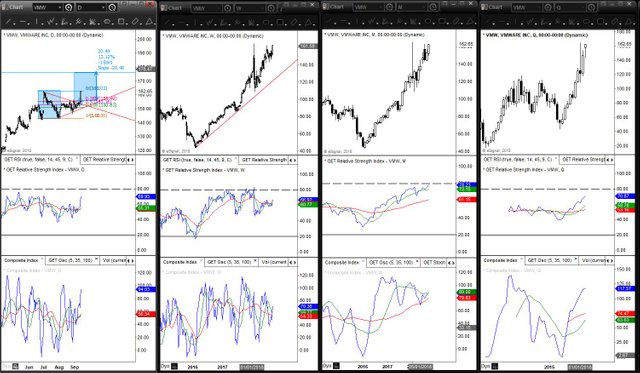
VMW, Vmware is a really nice setup. In the daily chart there was a nice triangle going on. Now, note in the daily chart where the blue circle is, the black body that formed today, formed above the red upper trendline. It is seen that from the entire line, this black candle was the first candles whose body, not wick, closed above the red trendline. Daily RSI is looking like a bullish setup as well. Area of $155.49 is being tested by fibonacci retracemnet 0.382. Once we get a 3% close above fibo 0.382, which would be $160.15, we can increase our position size. Our target would be $179. This is a 13% increse to capital. Update stock has broken out on Friday September 14 2018. Buy signal.
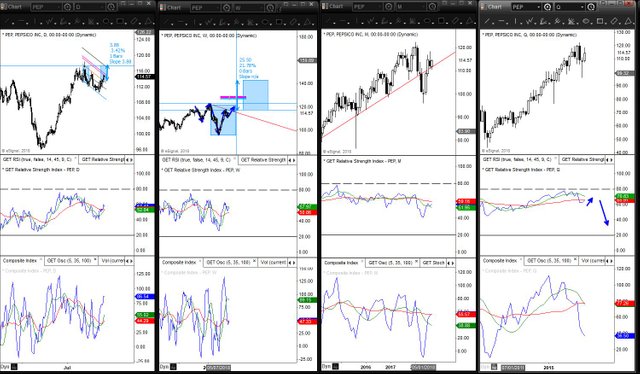
Today, 09/13/2018, PEP, PePsico, made a big move, 1%. There is good news in store for Ms. Noorya (CEO). PEP broke out of a bull flag, that has been forming since the end of July. Daily RSI is also confirming this chang in trend. The breakout point was $114. It has ended the day at $114.99, there is still a bit of a gain left as the target is $117.38. It can very well keep continuing from there. At todays close, PEP closed just before 1.5x the height of the bull flag. It may face resistence there and come down to correct or it may continue trekking up to its target. I believe it may favor the latter, contunuing up even after meeting its target, because the Composive Index is also very bullish for this in the weekly timeframe. In quarterly this stock will be making new lows, probably (see quarterly chart and follow with what I am saying), the RSI (blue line) will rise, only to be slammed back down by the Green moving average. The next statement, can void the previous statement. If Pepsico can close above $118 then, then this stock would be ultra bullish. Since July of 2017, there was been a massic head and shoulder pattern forming on PEP (note that weekly chart). As well the daily target is at $117.38 and the red trend line in the weekly chart is also at $118-117, so this a major resistence zone. If PEP can breach $118 and close above it then it would be a major buy signal for me. As well if PEP can make an all time high then I would be putting in even more capital since that would be the confirmation of a new bullish trend. The target for the H&S is $142. This is a 21.78% increase of the stock which is $25.50. PEP is definitely on my watch list for the upcoming future.
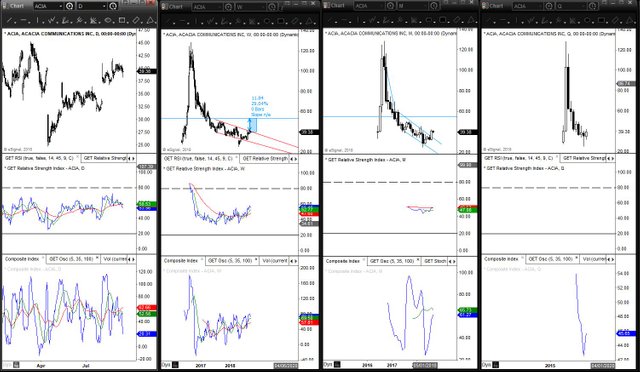
This stock is looking like a reverse Bitcoin. Its called ACIA, ACACIA Communications. It increased from $30 to $128 in 2016. This is like Bitcoin when it spiraled out of control,after it broke that parabola, the stock dumped enormously and made an all time low. It has now just broken out of its triangle and its target is $53 in the weekly terms. The weekly RSI is also looking very bullish. This stock can increase upto 29%! IF I get a close above $40.5 with a nice strong white body then I wil be entering. ACIA may come back to retest
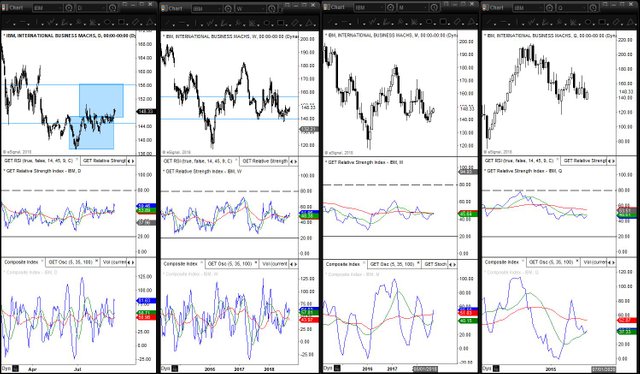
IBM, International Business Machs, would be boasting a nice gain in the next couple of days/weeks. A H&S has been forming since April of 2018, target for H&S would be $158.25 which almost a 7% increase for the stock. The stock has broken out of its neck line at $147. Currently closed Friday, September 14, 2018 at $148.33. Target of IBM would be $156, and stop right under $145. Weekly RSI is showing a bullish setup as well, so the rally may last longer.
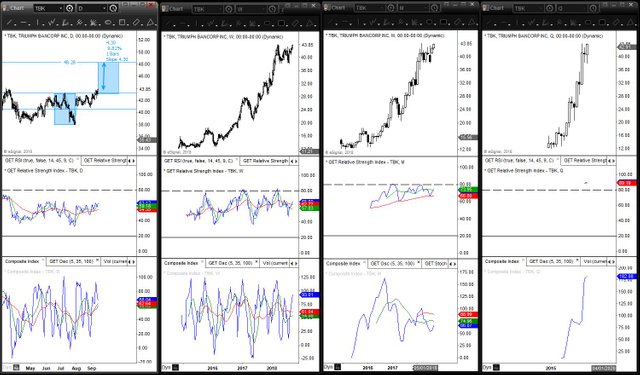
TBK, Triump Bancorp has broken out of a H&S forming since May of 2018. It neckline was $43.08 and closed today at $43.85 with a 1.74% gain end of day. TBK target is $48.28 which is an increase of $4.30 of the stock or 9.81%. Daily RSI is bulllish as well. Our stop woul be $40.61. Will keep you updated.
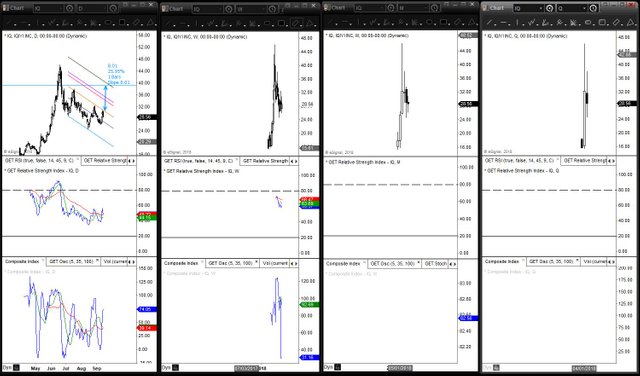
If, IQ, IQIYI, can break the the orange line (note daily chart), then this stock can possibly rally near $40. This would be a 25.92% increase for IQ. Daily RSI is generally bullish but formed how I like it. This stock has a high reward but also a high risk. I leave it to you...
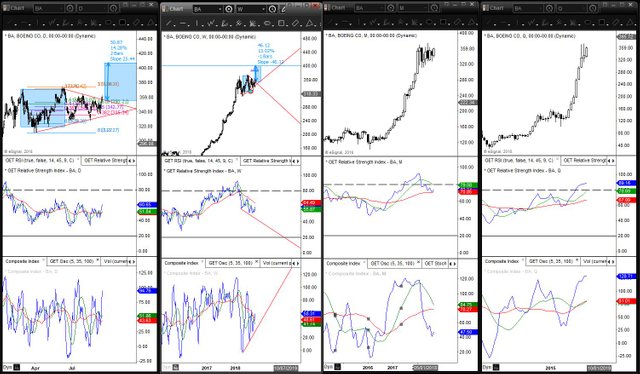
BA, Boeing, is about to take off. Boeing has been making a trinagle since Febraury of this year. It has just broken out at $357. It closed today, Friday 09/14/2018 at at $359.80. It has broken out nicely and the Daily RSI is pointing upwards. No clear signals at weekly level, but a divergence has occurred. Bullish… Our target for BA would be just under $400, an increase of ove 13%. Big gains for such a big airline company. Our stop would be at $349.97 but if you are a more aggressive trader then you can put at $342 or even $335. I like this stock right now because the pattern is so clear, even a novice would be able to see it, its clearity is showing me that this would be a nice setup. If BA is this bullish then maybe other airlines companies would be too, I wil cover that in my next weeks report. If I don’t include the other airline compnaies, that means that none of them showed nice setups.
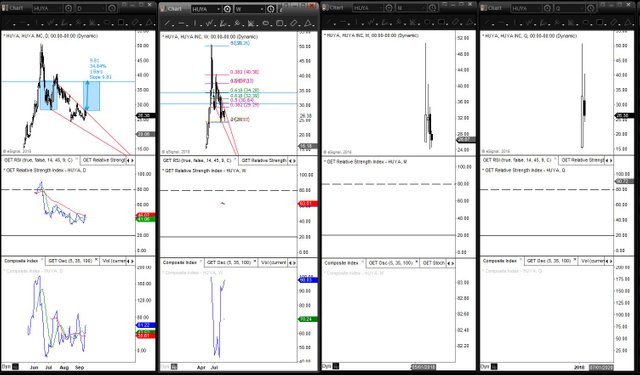
Just like IQ, the stock HUYA, HUYA Inc, is also a high reward trade and a high risk trade. The market cap is 5.37 Billion $ so there should be no problem, but the stock is relatively new, only since May of 2018. The Daily RSI as well does not classify under my bullish signal, but it is definatly pointing higher. This stock has already made a high wick above the the red upper trendline but failed to close above it. In this stock after it breaks and closes after the upper red trendline then I would put in 0.5% of my capital into this trade. If the trade goes in my favor then it is a high percentage that’s why I need to put so little capital. If my capital is $100,000 and I usually put 2% of my capital in a trade – which would be $2,000. And my average trade increases lets say for this demonstaration 5% then the $2,000 turns into $2,100. That is a profit of $100. But for this trade I put in .5% of capital – which is $500 and this stock increases to my target level just under $38, which would be a percentage increase of 34.84%. Then, the $500 I put in turns to $674.2. That is a profit of $174.2. For this demonstration this would be more than I earn when I put in 2% of my capital on a trade. That is why for high risk/high reward you can still make it out well if you put way less capital than you usually put on a trade. (Cryptos is an entirely differnet story, I’ll cover that another time.) The stop for HUYA would be around $24.50. Enter ONLY after a close above the red upper trendline.
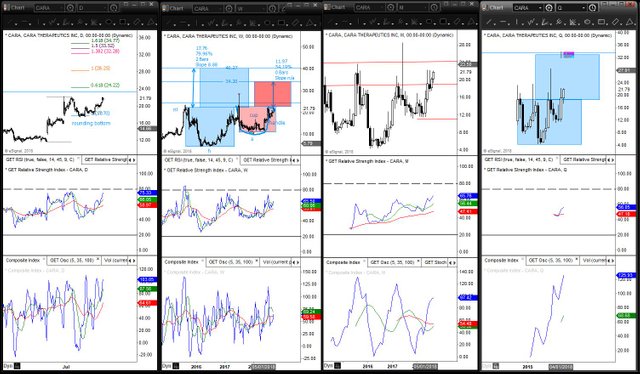
One of the biggest winners on this list wuld be the one I am just about to introduce. It is CARA, CARA Therapeutics Inc. The market cap for CARA is only 834 Million $ but it has been trading since 2014, so there is a history. The chart for CARA is quite complex and there can be many possibilites. The most immidieate target is being confluenced by three different techniques.Firstly, (see daily chart) the fibonacci extension that I applied its 1.618 is $34.77. Secondly, (see weekly chart) the red boxes that are stacked upon each other are price targets by the cup and handle that was forming since June of 2017. The target of the very nice cup and handle would be $34.20. Thirdly (see quarterly chart) the blue boxes stacked upon each other represent a massive head and shoulders. Their target is $33. These three create a massive confluence and resisistence at price in between $33-35. This is what is leading me to believe that this stock will have massive gains over the next couple of months. That target of $34 would be an extraordinary 54.19% increase fo CARA stock price. The second target which is a long shot as of right now would be $40.27. (See weekly chart) My stop would be just under $11 which would be a steep loss. On the bright side, you also have to look at the possible gains from the stock. I purchased 50% of my usual size on a trade and the rest 50% I will purchase after it breaks and closes $24.00. This would be a great trade if it reaches my expectations.
In this weekly market report I have listed over 15 different stocks. Some to enter and some to keep a close eye on. Spent over 10 hours analyzing this stocks, only time will tell if my time was invested or lost. Lets see how my picks do over the next couple of days and I will update you guys next weekend.
Have a nice weekend and see you soon…
This user is on the @buildawhale blacklist for one or more of the following reasons: