Pretty Much Every Chart Shows that the Market is Screwed
It’s always possible to dig up a bearish chart somewhere, even in the best of circumstances. But when practically every chart you find is downright nihilistic about the state of the markets, it’s bound to give you pause – and make you rethink your equities allocations.
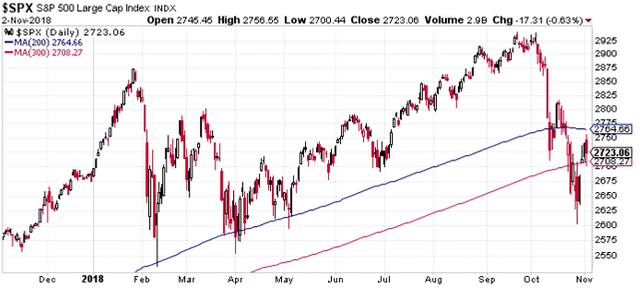
The king of market indexes would be the S&P 500, so that’s as good a place to start as any. Everybody and their uncle uses the 200-day moving average as a barometer of technical health, and I added the 300-day moving average to help me break down whether the market is, indeed, breaking down:
Courtesy of stockcharts.com
Yep, it’s breaking down. The slide below the 200-day moving average is decisive and forceful, and that’s significant because we can see how that line had provided crucial support several times this year. No such luck this time around: what was support is now resistance – a hard ceiling until proven otherwise.
Currently the price is perched upon the 300-day moving average, which was broken but is now regained – at least for now, and just barely. It wouldn’t take much to push it back below the line, and that would scare a whole lot of weak hands out of the market, which in turn would push the price even lower.
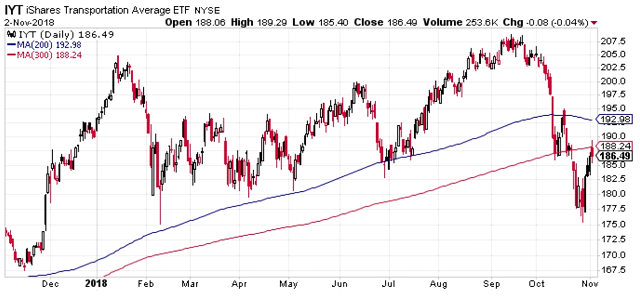
Let’s now put the magnifying glass to the transportation sector, which, according to Dow theorists and some analysts, are an indicator of the health of the markets and economy. There’s very little that could be called “encouraging” about the transports chart, which actually looks worse than the S&P 500 chart:
Courtesy of stockcharts.com
With the transports, we see that the 200-day moving average is basically toast, and the 300-day moving average is stubborn resistance. The attempt to break above the 300-day moving average was thwarted and it just looks like the sector is running out of steam
93% Of Investors Generate Annual Returns, Which Barely Beat Inflation.
Wealth Education and Investment Principles Are Hidden From Public Database On Purpose!
Build The Knowledge Base To Set Yourself Up For A Wealthy Retirement and Leverage The Relationships We Are Forming With Proven Small-Cap Management Teams To Hit Grand-Slams!
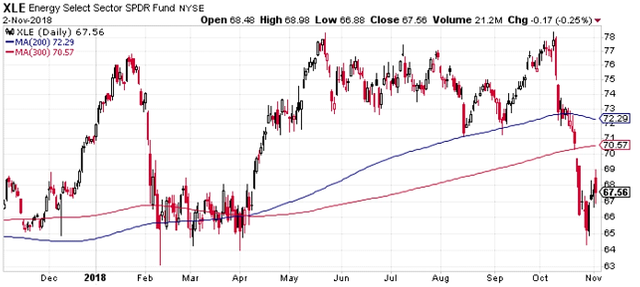
Perhaps the energy sector will lift our spirits a bit… After all, it’s an integral component of the economy and in any case, technical analysts could sure use some good news right about now. Let’s take a look and see if there’s anything here to encourage us:
Courtesy of stockcharts.com
Just when you thought things couldn’t get any worse… they just got worse. The recent candlesticks aren’t even close to the 200- and 300-day moving averages. To say that this sector has “run out of energy” would be an awful pun but not an inaccurate observation.
We’re getting desperate here for some signs of life, so let’s try one more sector: the tech stocks, which almost single-handedly held up the U.S. market for years. Can the FAANGs and other tech stocks prop up the markets just once more, for old times’ sake?
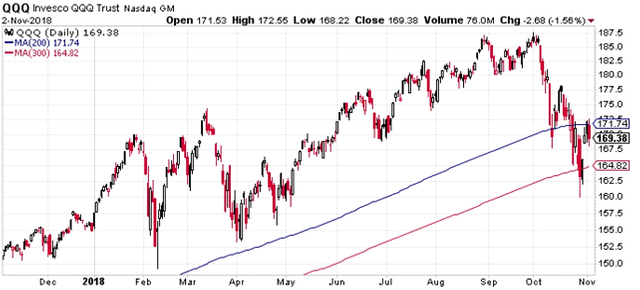
Courtesy of stockcharts.com
Tech isn’t exactly the savior that the market bulls were looking for, though admittedly it did bounce off of the 300-day moving average. Still, it has to decisively clear the 200-day moving average to prove its resilience in this shaky market environment.
Whether the FAANGs can inspire the markets to break their recent losing streak remains to be seen. As for me, I’m content to sit back, heat up some popcorn, and enjoy the freak show
Original Article Available HERE
Early last month I was surprised that my trading indicators started closing out my positions and taking me short when everyone was talking about how great the market was... and then it just sort of collapsed!
Looking like a choppy period ahead, but some tentative long positions are in place to benefit from dead cats bouncing...
Thanks to @paradigmprospect, this post was resteemed and highlighted in today's edition of The Daily Sneak.
Thank you for your efforts to create quality content!
Cannabis is too young to save the market yet that is where I am investing primarily! during this little downturn I made money on Ford and found BPT paying 15% dividends... interesting to hear what you think of them?