Bonds v. Stocks YTD Performance (VTSMX, VGTSX, VBMFX, VTIBX, & VWITX)
Index - https://steemit.com/tax/@alhofmeister/2dob8f-tax-blog-index
Introduction
The purpose of this post is to demonstrate the YTD performance of domestic and international stocks and bonds by comparing various Vanguard index funds. As demonstrated by the graphs, bonds have been significantly more stable than stocks. Additionally, international bonds are currently outperforming U.S. bonds as well as U.S. and international stocks. In this post, I added municipal bonds as well to track the tax free option. I will continue to track the progress of these index funds in future posts.
YTD Performance
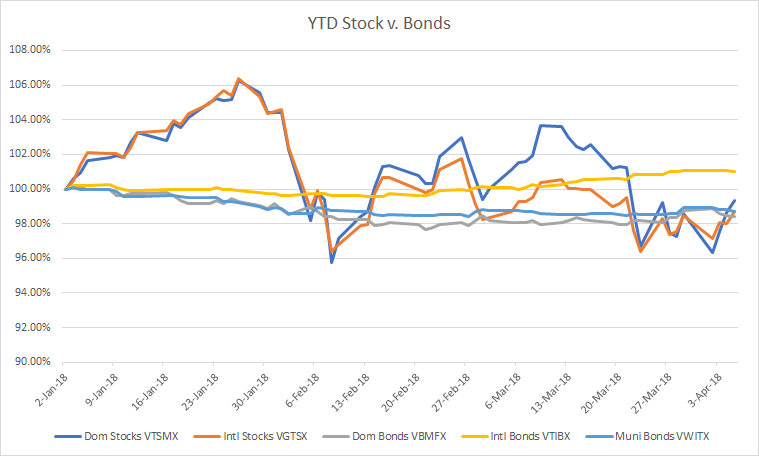
Note - Chart also reflects the periodic dividends paid by the various funds (stocks - quarterly; bonds - monthly)
References
https://finance.yahoo.com/quote/VTSMX/history?p=VTSMX
https://finance.yahoo.com/quote/VTSMX/history?p=VGTSX
https://finance.yahoo.com/quote/VBMFX/history?p=VBMFX
https://finance.yahoo.com/quote/VTIBX/history?p=VTIBX
https://finance.yahoo.com/quote/VWITX/history?p=VWITX
@contentvoter
Are the international bonds just an average of all bonds that are not U.S bonds? Bonds might look very rewarding in comparison to the stock market right now. But in the long run, you are definitely missing out if you are not in the stock market
The international bonds presented in the graph are from the Vanguard International Bond Index Fund VTIBX (link provided in the article). While stocks have been proven to be more profitable in the long run, bonds provide stability. Investors who require funds in the short term or investors expecting a prolonged bear market might consider bonds over stocks.
With how this year is going your prob better off in bonds lol